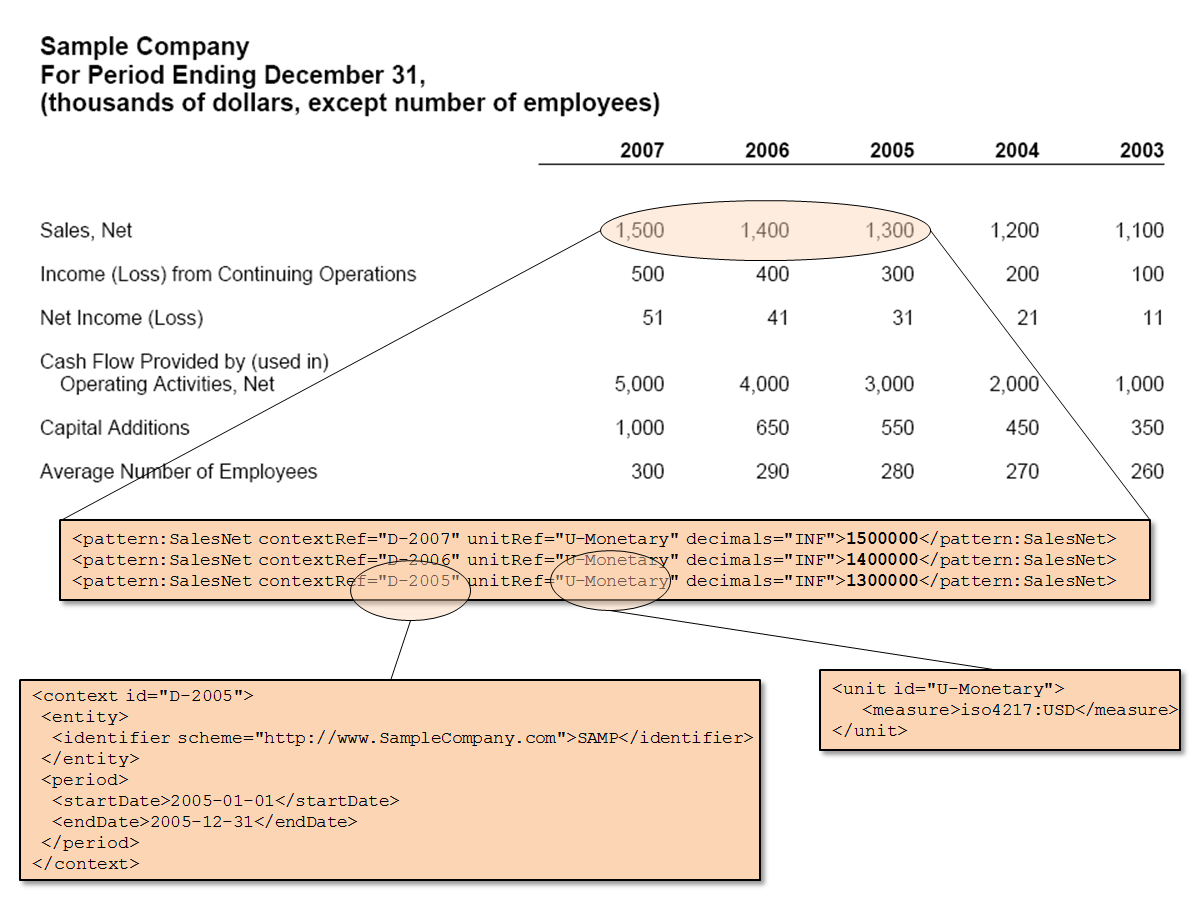
The following is a graphic of an XBRL instance which, I believe, helps people visualize the connection between the "tags" and a "printed" business report be it on paper, in PDF or HTML, etc.
 XBRL Instance GraphicOne could go on, and on, and on with this; connecting the concept to the XBRL taxonomy, the taxonomy concept to resources and relations. Wouldn't it be great if software applications did this for you! Would help visualizing the information, finding errors, etc. Clearly you would not want to see the tags, but rather interfaces that show the information contained within the tags.