Yesterday I prototyped a Tableau visualization which was fed by a prototype dynamic OData web service feed. Last night, one of the developers at 28msec created a prototype OData output format from their SECXBRL.info web service API. They took this query, and converted this XML format of that query into OData which Tableau supports, and you get this Tableau dashboard:
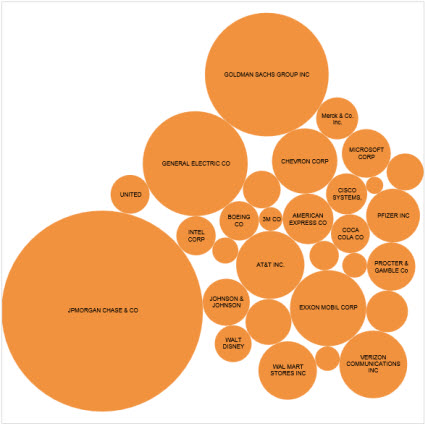 (Click image to visit dashboard)
This is awesome, awesome, awesome. Why? An SEC filer can submit a report in XBRL and a query like this would be dynamically updated as a result, feed this visualization, and the visualization is adjusted for the new information. Any business user can create something like this by copying and pasting a URL into Tableau or editing a pretty basic URL.
So, this is up and running on the SECXBRL.info test server which I have access to but cannot make that available publicly. But, I speculate that I can lobby 28msec to get this in their development cycle and they could have this working in a week or two.
To see how this work work, go to this query page, create whatever query you want, and then go to the upper right hand corner and press the "EXPORT" button. Select the XML format and look at the URL. How easy is that!