Imagine being able to do analytical review or benchmarking or analysis at a completely new level. Below is a protype I created in Excel of a chart which shows the current ratio (current assets / current liabilities) for every public company that reports a classified balance sheet:
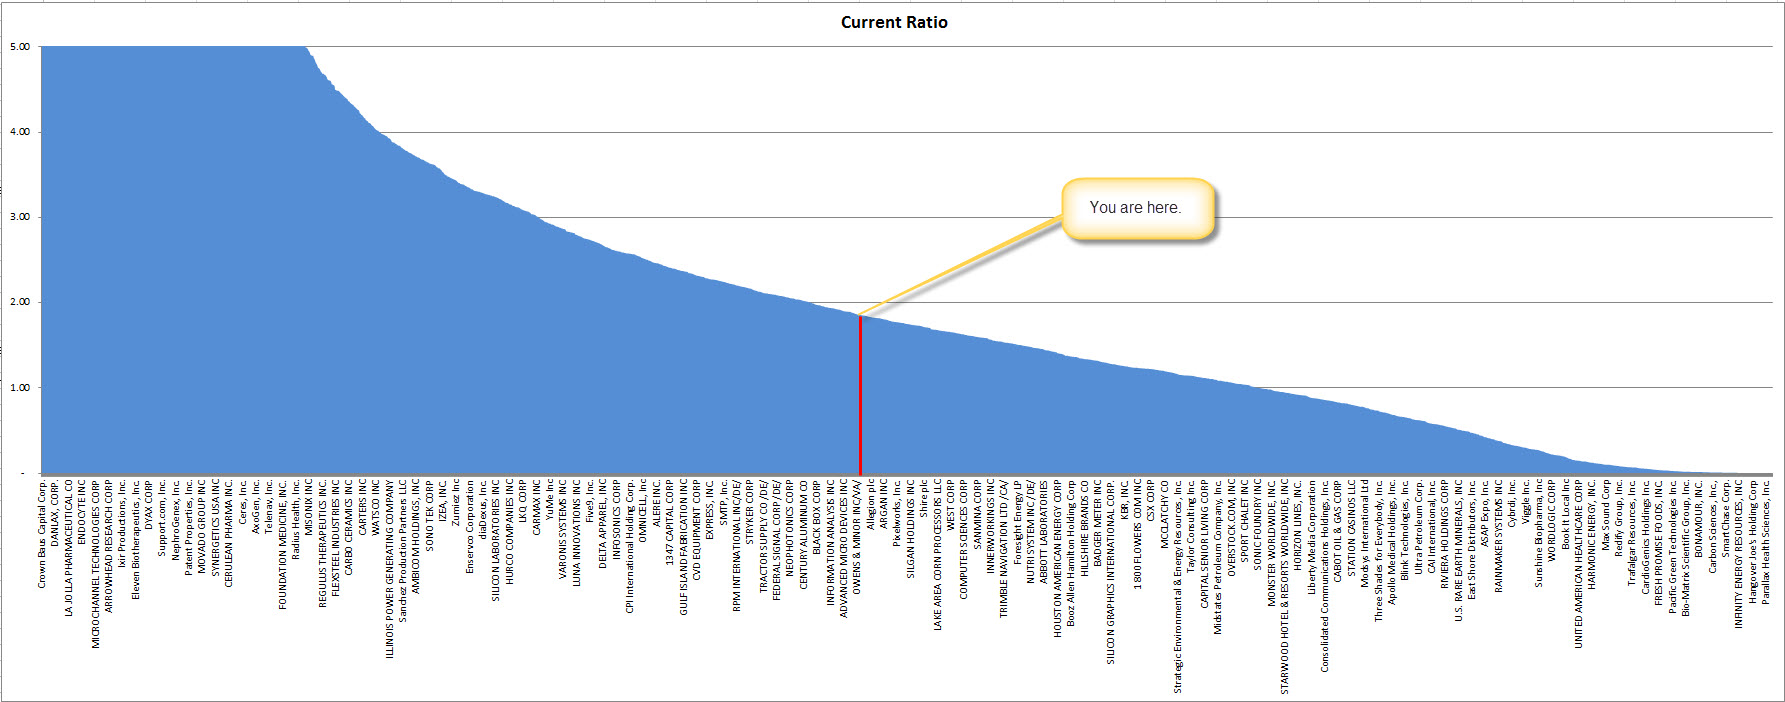 (Click Image for Larger View)
One day analysis will be less about rekeying information into a spreadsheet and more about the analysis. Imagine being able to then click on any public company name and the balance sheet pops up. Imagine this for the hundreds if not thousands of data points, key ratios, etc.
Imagine having an analysis using information from this paper, A Data Mining Framework for Prevention and Detection of Financial Statement Fraud. In Table 1, they have 62 financial items or ratios. Heck, I have the information to compute 35 of those in my fundamental accounting concepts.
Think accounting quality model; Robocop.