Every now and then I get to a point where I become so overwhelmed with information that I know is important but I have not been able to organize, summarize, and otherwise synthesize it enough to make it as coherent as I want it to be. I am at that point.
The last time I was at that point was before I created the document Computer Empathy. That document is by no means the perfect organization of information but it is a very good inventory of the moving pieces of a puzzle that I was trying to put together. Besides, it lead me to the exact same conclusion that others independently came up with when the created the idea of "computational thinking" that basically everyone needs to understand. That bottom line has two points: (1) if you want to get a computer to perform useful work for you reliably you need to understand how computers function; (2) computers work using the rules of logic.
This time I am not sure what the point is yet. I have confidence that it will appear, but I have not arrived at that destination yet. But, here are the current puzzle pieces that are scattered around that I am trying to arrange: (currently in no particular order)
- Distributed Ledgers+Smart Contracts+XBRL: There is a connection between distributed ledgers, smart contracts, the capabilities of XBRL, triple-entry accounting, and the modern finance platform.
- Fact ledgers: Accountants understand HOW to do double-entry accounting; but what I am seeing is that many accountants, including myself, don't understand WHY they use double-entry accounting. Maybe it was never explained to them. Maybe they forgot. For me, I don't know if it slipped my mind. The fact ledger leverages the ideas of the ledger and the journal to create machine-readable versions of those to important tools of accounting.
- Leveraging the Theoretical and Mathematical Underpinnings of a Financial Report: This document explains the theoretical and mathematical underpinnings of double-entry accounting and financial reports. A financial report is a graph of facts. That graph of facts includes transactions, events, circumstances, and other phenomenon of an economic entity that fits into two categories: things that went through the general ledger (double-entry) and things that did NOT go through the general ledger (single-entry).
- Leveraging XBRL's Extensibility Effectively: XBRL builds on top of XML. Native XML is not extensible; XBRL can be safely extensible. If you choose to leverage XBRL's extensibility you have to manage that extensibility appropriately. A complete set of clear rules is mandatory for information conveyed within an XBRL instance to be understood as intended if extensibility is used.
- Understanding and Appreciating the Capability to Recognize and Identify Blocks: This document explains a technique that I came up with, the Block, that allows software to interact with XBRL-based information effectively.
- Chain of Capabilities Necessary to Automate Accounting Processes: As the notion of irreducible complexity points out, there is a chain of capabilities that must be mastered in order to effectively and reliably automate accounting processes. I provide a precise list of the capabilities that are necessary to master, but I am not 100% certain that the list is sufficient. The first software vendor that masters this chain of capabilities, understands the Law of Conservation of Complexity, and creates functional software that is truly usable by professional accountants will win big.
- General Ledger Trial Balance to External Financial Report: This document summarizes a basic example of putting all the pieces together to go from a general ledger to an external financial report for all the transactions that flow through the general journal to the general ledger. All those pieces fit together. What this example does not show is the transactions, events, circumstances, and other phenomenon that does not flow through the general journal and general ledger.
The vision of the modern finance platform is articulated well. Blackline articulates their vision "...to modernize the finance and accounting function to empower greater productivity and detect accounting errors...". Jun Dai and Miklos Vasarhelyi of Rutgers University provide a vision of what auditing will be like in their papers Imagineering Audit 4.0 and Toward Blockchain-Based Accounting and Assurance. Auditchain has a vision and is building what they call a continuous audit and reporting protocol ecosystem. Pacio is also building an ecosystem that includes what they call a standardized semantic information model (SSIM). GovernanceChain is building "the triple-entry accounting network".
There are three graphics that I would like to combined into one composite graphic. I have broken down the processes and tasks involved in creating an internal and external financial report as such (my graphic was inspired by this graphic of Blackline):
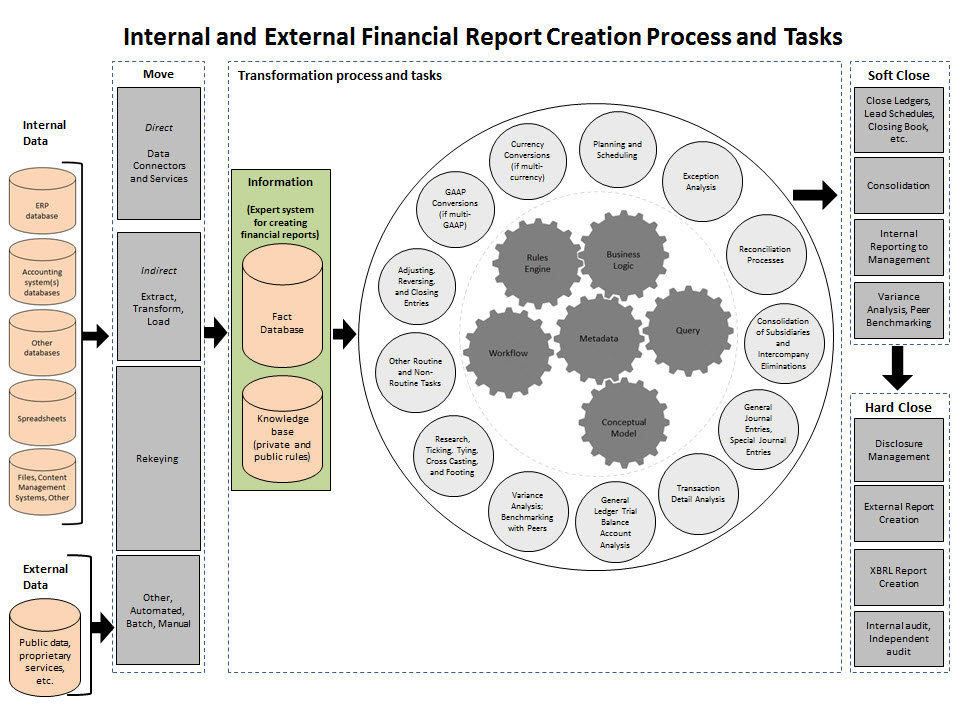 (click image for larger view)
Jun Dai and Miklos Vasarhelyi of Rutgers University have a graphic that describes their notion of a "mirror world" and how mirror worlds relate to the real world:
 (Click image for larger view)
Paico has a pretty good infographic which describes their specific system:
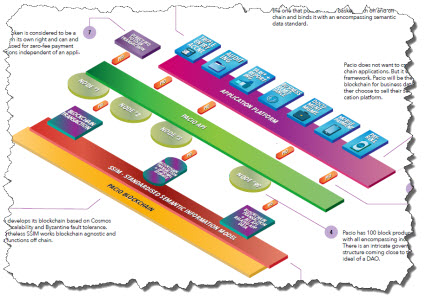 (Click image for larger view)
I have some other graphics from an accounting information systems text book that I have which are pretty good. Plus, I have some other graphics. What I want to create is one graphic that pulls all of these ideas together.
All my ideas are instantiated within a solution which is contained in this ZIP file which you can download. There are two software applications which will execute all those rules which results in these two packages of information being generated:
- Evidence Package: Allows user to view the pieces of a report and validation information
- Reporting Checklist: Tests the pieces of the report to make sure they conform to rules.
What I would really like is for those two sets to be combined into ONE set of information. Secondly, one downside of the above information is that it is static rather than dynamic. The second software application provides a more dynamic interface, you can download and try that software here.
The documents show two other examples. The first example is simpler and easier to follow. The second example is an actual XBRL-based submission to the SEC which is extremely robust, but incomplete in some areas.
And so my task: How do I simplify all this and explain it?
Stay tuned, I am sure I will figure it out.