In his book Saving Capitalism, Robert Reich describes three categories that all modern work/jobs fit into: (page 204)
- Routine production services which entails repetitive tasks
- In-person services where you physically have to be there because human touch was essential to the tasks
- Symbolic-analytic services which includes problem solving, problem identification, and strategic thinking that go into the manipulation of symbols (data, words, oral and visual representations).
In describing the third category, symbolic-analytic services, Mr. Reich elaborates:
In essence this work is to rearrange abstract symbols using a variety of analytic and creative tools - mathematical algorithms, legal arguments, financial gimmicks, scientific principles, powerful words and phrases, visual patterns, psychological insights, and other techniques for solving conceptual puzzles. Such manipulations improve efficiency-accomplishing tasks more accurately and quickly-or they better entertain, amuse, inform, or fascinate the human mind.
And of course you as, "What the heck does this have to do with XBRL or financial reporting?"
Why this is interesting to me is the third category of work/jobs: symbolic-analytic services. Financial reporting, or at least many tasks related to financial reporting, fall into the symbolic-analytic service category.
How many professional accountants think of their job as "rearranging abstract symbols using a variety of analytic and creative tools". Not many. Most professional accountants just do the work. Besides, what the heck is an "abstract symbol"?
Consider the ledger:
 From http://digitalroam.typepad.com/photos/uncategorized/2008/04/19/ledger.jpg
There is nothing natural about the ledger. A ledger was an invention of man. Those columns are abstractions. The numbers and other information that go into the columns are symbols. The ledger is a useful idea.
A table is likewise a useful idea, an abstraction. A table has rows. A table has columns. A table has cells which are the intersection of a row and a column. So actually, do you realize that a table can have way, way more than rows, columns, and cells? What about groups of rows. And groups of columns. What about a row that spans more than one column. You might not have known that there is actually a specification which describes tables, the CALS Table Model.
Why would someone create a written specification for a table? Well, that is how you make it so machines can read a table and that tables created on one machine can also be read on another different machine. A specification explains how to create tables consistently.
An electronic spreadsheet is really nothing more than a fancy table that is machine-readable but also readable by humans. At first Excel was a proprietary Microsoft specification but eventually a standard spreadsheet model was created, OpenOffice.
The point of mentioning this is that spreadsheets are creative tools for rearranging abstract symbols. This tool, similar to a table in that it has rows, columns, and cells; but also adds the idea of a sheet and a workbook.
You can think of a digital financial report as a spreadsheet on steroids. First of all, a digital financial report is more like a dynamic pivot table than a static table. You can see this by checking out any XBRL-based public company financial report submitted to the SEC here using the XBRL Cloud Viewer. Just click one of the "View" buttons in the "Interactive Reviewer" column. (Try pivoting the [Axis] within a report.)
So back to the notion of symbols. An alphabet is a set of symbols. Morse Code is a set of symbols. While you can write Morse code or the letters of an alphabet, you can also make it so machines can understand the symbols. An ASCII, American Standard Code for Information Interchange, is a set of machine readable codes for representing an alphabet in machine-readable form. UNICODE is the most current set of machine readable codes.
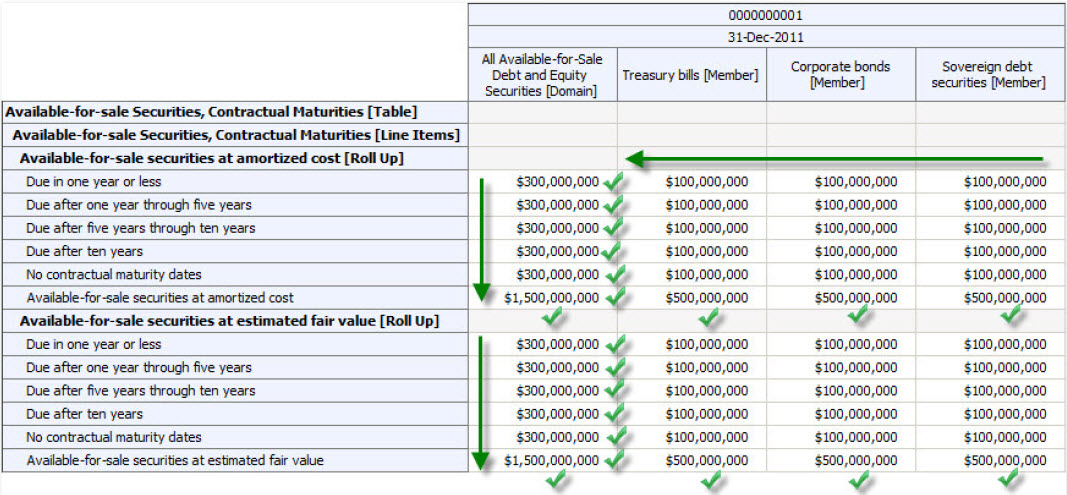
XBRL is a global standard for representing the information that is contained in a financial report in machine-readable form. Consider this one small part of a financial report:
 Click for larger image.
You can represent the rows, the columns, and the cells of the disclosure above. You can represent the relations between the total with the information that makes up the total (i.e. you can articulate the the information foots). You can articulate that the PARTS of some WHOLE add up to that WHOLE, i.e. the WHOLE is the sum of the PARTS. These are only examples of some of the possibilities.
Creating an XBRL-based financial report involves rearranging abstract symbols using creative tools. What is different is that the rules related to how the information can/should be arranged is in machine-readable form and therefore a computer can have that knowledge and provide this knowledge to a user of the computer. Before digital financial reporting knowledge was only in the minds of the professional accountants. This is because no one took the time to represent the knowledge in machine readable form. All that changes with XBRL-based digital financial reporting.
Today, only minor pieces of knowledge are represented in machine-readable form. For example the fundamental accounting concept relationsof US GAAP primary financial statements, some basic disclosure information, and some other stuff. These are only the tip of a much larger iceberg.
What if a disclosure checklist was represented in machine-readable form and could be used to automate 50% of what you do manually today? Now, 50% might not be the right number; it is likely on the conservative side. I know the automation percentage is not 100% because I understand disclosure checklists and I understand what computers are capable of. I will stick with 50% for now, could be as high as 80%. But undoubtedly, digital financial reporting will change the work practices of professional accountants.
The benefits of digital financial reportingare hard to argue against. It is only a matter of time before the transformation occurs. Resistance is futile, you will be assimilated! Digital financial reporting is not only inevitable, it could perhaps even be imminent. Time will tell.
If you want to understand the abstract symbols of a financial report, read the Financial Report Semantics and Dynamics Theory. If you want to dig even deeper, read the Digital Financial Reporting Manifesto. Or, check out the series of videos I created, Introduction to Digital Financial Reporting Terminology.
Why would you do that? Here is another thing Mr. Reich mentioned in his book,
We are faced no just with labor-replacing technologies but with knowledge-replacing technologies.
When a transformation occurs there are winners and losers. Be sure to end up on the right side of that equation.