Just because some of those who implement XBRL in a manner that DOES NOT take advantage of XBRL's power to express business rules does not mean that XBRL lacks that expressiveness. A quick reminder that expressiveness of a language is directly related to what can be automated because it minimizes possible information quality issues. And so, understanding XBRL expressiveness is important and understanding how to create business rules leveraging this power is likewise important.
This blog post walks the reader through a prototype for the XBRL US Work in Progress (WIP) Taxonomy which is seeking public comments. I created this prototype to help me understand the taxonomy and to provide feedback to the creators of the taxonomy. While this prototype relates specifically to the WIP taxonomy; the ideas presented here are general to all digital business and financial reports.
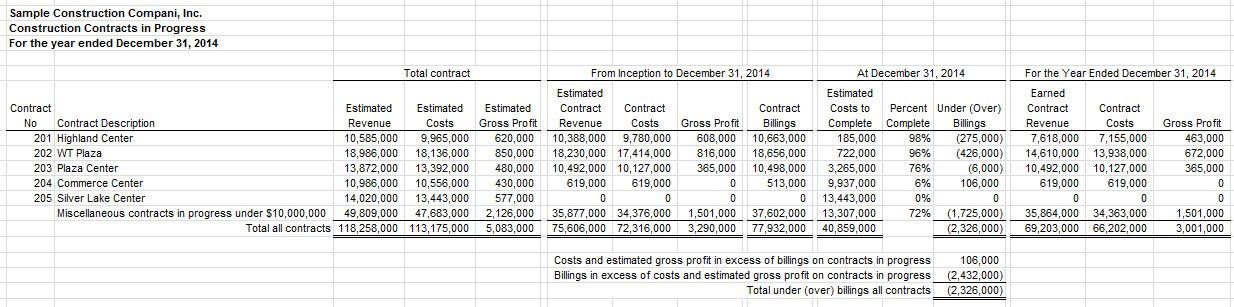
The Work in Progress Taxonomy is used by construction contractors and insurance companies to exchange information related to "work-in-progress" information related to construction contracts for the surety bonds issued by insurance companies and banks (loans).
Here is a sample of one specific schedule which a contractor might create an report to an insurance company or bank. The WIP taxonomy is for the creation of such reports. This is a small but relatively sophisticated report so it provides an excellent example for what I want to show. (I got this example from a video of creating this schedule provided by DataTracks.)
 (Click image for larger view)
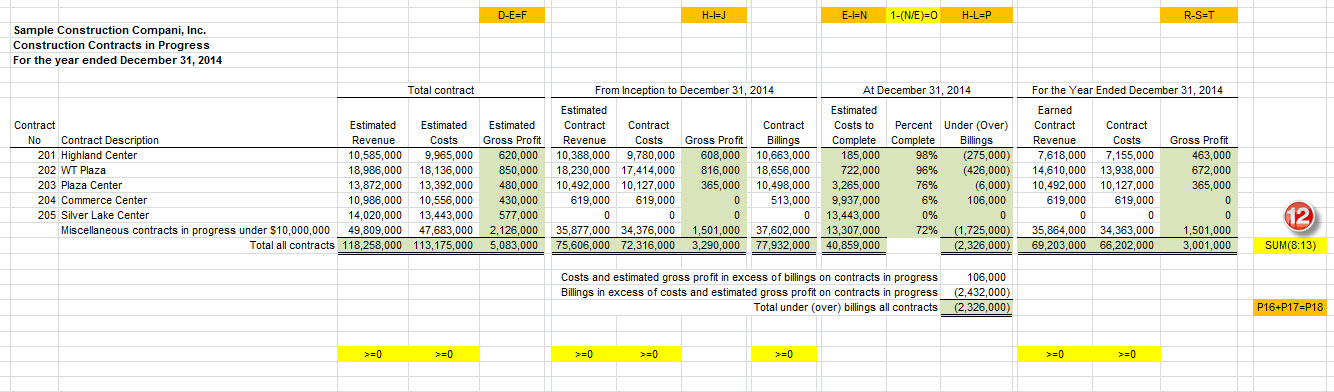
I modified that first screen shot slightly to point out the business rules that exist in that schedule. On this screen shot below I have added ORANGE and YELLOW relationship indicators. The ORANGE business rules can be expressed using XBRL calculation relations. The YELLOW are beyond the capabilities of XBRL calculations and require XBRL Formula to express those business rule relations:
 (Click image for larger view)
If you count you will find that I have pointed out 26 different business rules which need to be represented. There are 15 ORANGE and YELLOW cells, but the YELLOW cell to the far right needs to be created for each of the 12 numeric columns. So 14 of the 15 are created once and 1 needs to be created 12 times; so 14 + 12 = a total of 26 business rules. (I will show you each rule in a moment.) Now, 6 of the 26 rules can be represented using XBRL calculation relations and 20 need to expressive power of XBRL formula to represent the business rules effectively.
If you count the FACTS on the report you will find that there are a total of 93. Keep that number in the back of your mind.
Now, to make what I want to show a little easier, I created the 6 XBRL calculation relations and I duplicated those relations using XBRL Formula; so basically I created all 26 business rules using XBRL Formula so that I can see all the business rules in one location. Here is the XBRL Formula file which contains those rules:
http://www.xbrlsite.com/2016/Prototype/WIP1/abc-20160131_formulas.xml
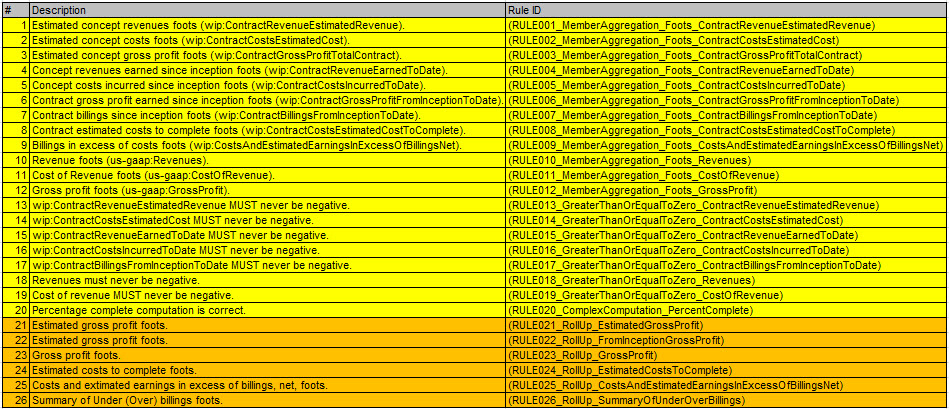
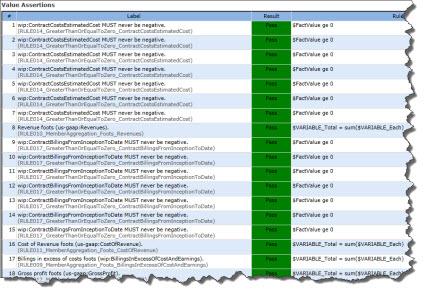
Now, while that file is easy for machines to read, it can be hard for humans to read. So, here is a list of those business rules in human readable form. Note that the rules that are also expressed using XBRL calculations are shown in ORANGE, the business rules highlighted with YELLOW require XBRL Formula to express:
 (Click image for larger view)
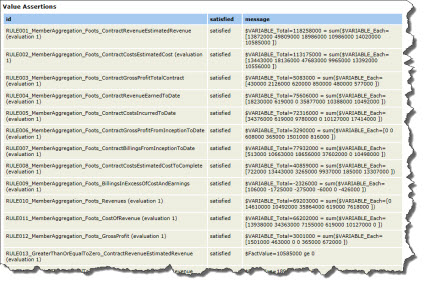
When you run the rules against an XBRL instance, some rules might execute more than once. All of the rules will execute based on the relations between the facts. What will make this clear is to actually look at the validation results. The validation results are shown next from two different XBRL Formula processors. Each output has its pros and cons. One list shows the count of 104 times the rules filed, so you can get the total count. The other shows the actual fact values which is helpful. Between the two reports you can get an idea of what the rules do.
Validation results (from the UBmatrix XBRL Formula Processor)
 (Click image for complete list)
Validation results (from the XBRL Cloud XBRL Formula processor):
 (Click image for complete list)
And so, a total of 93 facts and 104 tests to make sure the facts are correct if both XBRL Formula and XBRL calculation relations are used. You know what the rule count would be if you ONLY used XBRL calculations? It would be 42.
So what is the deal with the difference between the 104 validations done using XBRL Formula and the 42 that you get using only XBRL calculations? Well, those would be opportunities for error because there are no business rules watching over the information entry process!
It is that gap that is one cause of data quality problems of XBRL-based public company financial reports to the SEC. Notice that I am testing ONE schedule. How many schedules does a 10-K financial report have? Lots and lots.
And I am only focusing on computations here. There are many other types of relations which could be represented correctly, or potentially incorrectly, if you do not have business rules watching over the information creation process. Remember; the only way a meaningful exchange of information can take place is with the prior existence of agreed upon technical syntax, business semantics, and workflow rules.
This graphic can be a bit overwhelming, but it puts all this information into one place. You see the information, you see the rules, and I try and link as much of this stuff together so that you can get your head around it:
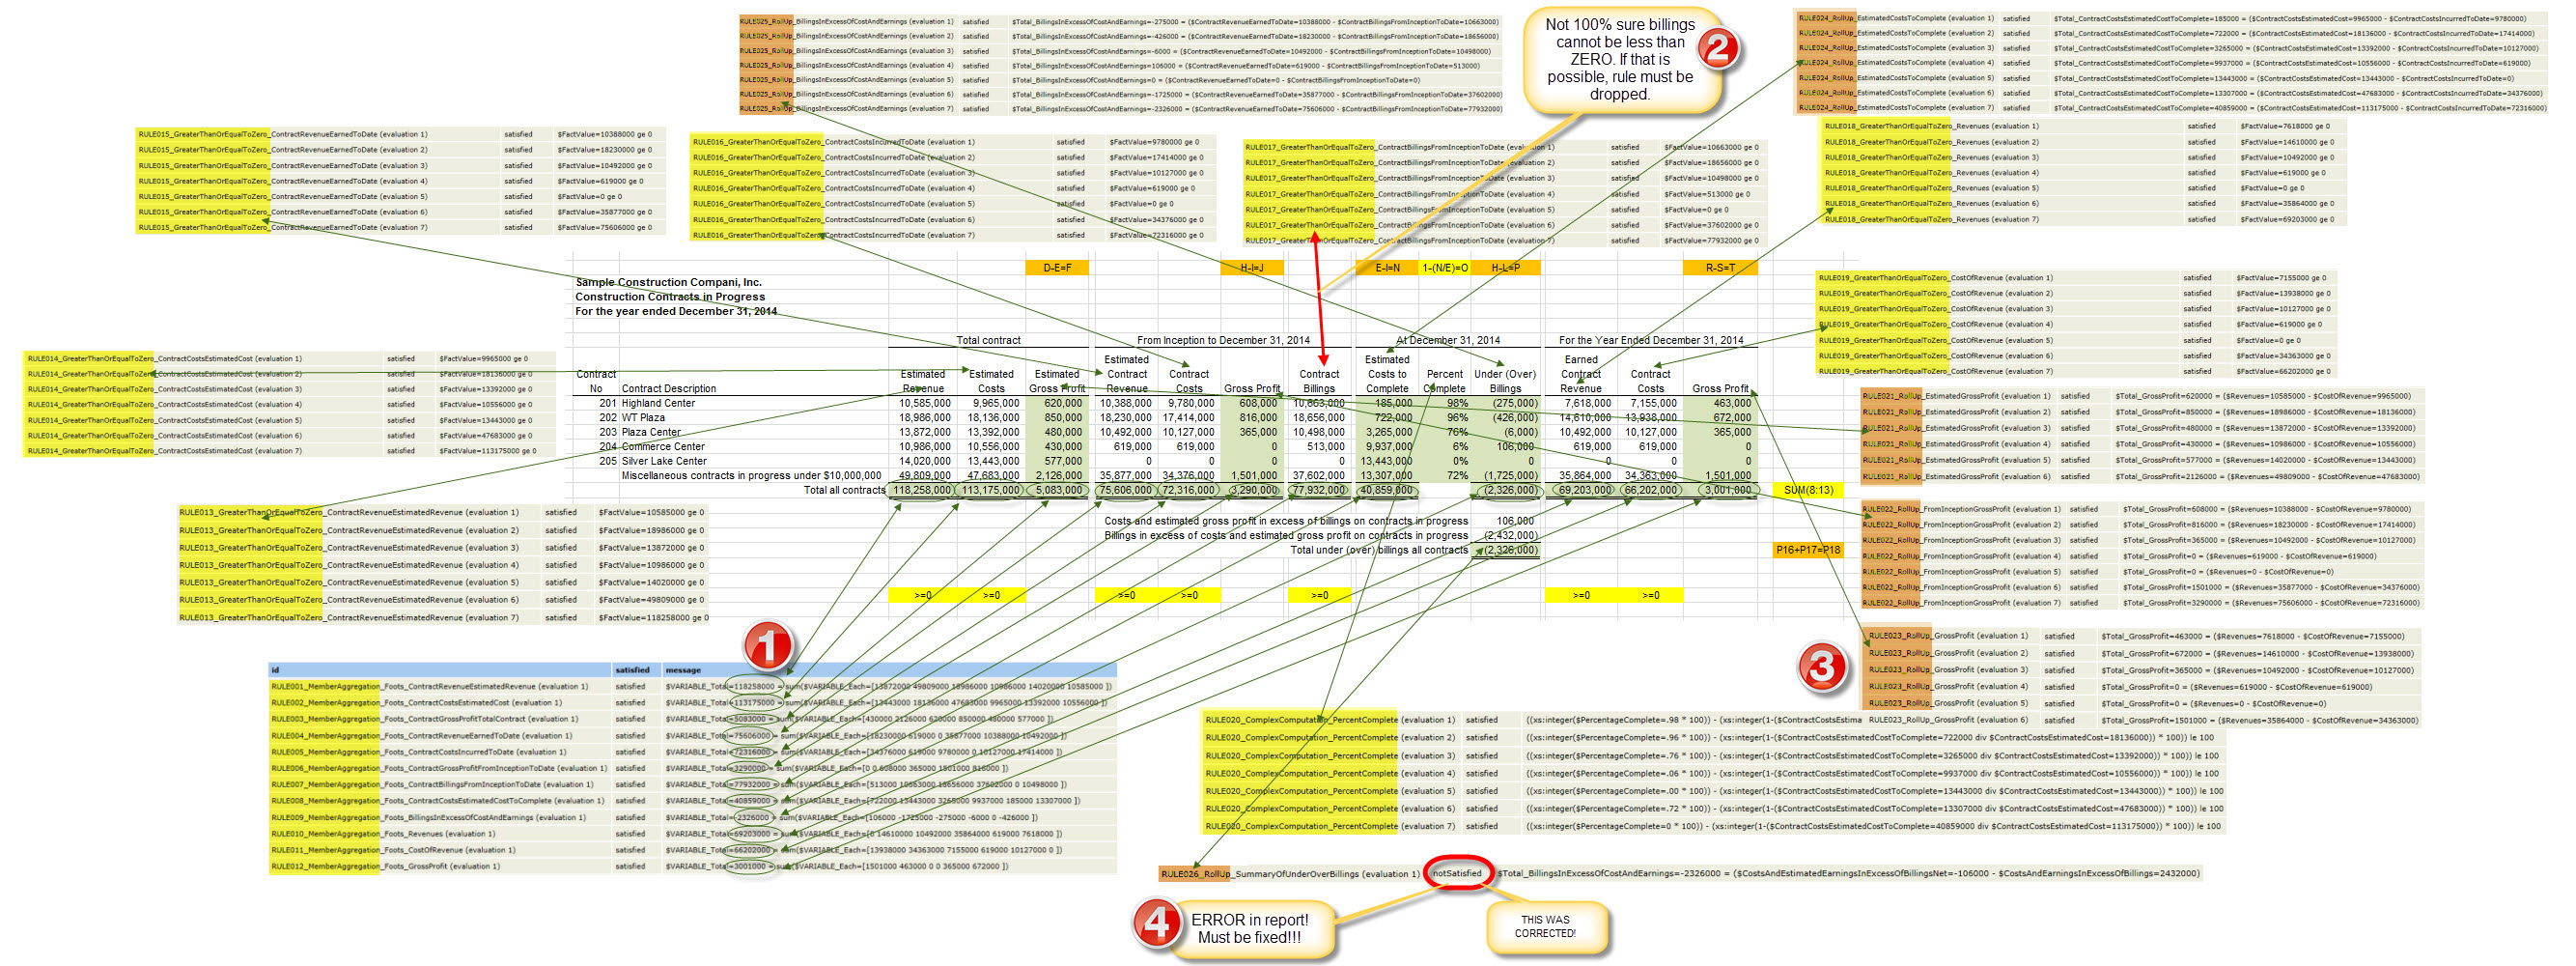 (Click image for larger view)
I won't bother to explain this. It will resonate with some, not with others.
For those who want to run this validation themselves using their favorite XBRL Formula processor, here is a ZIP file that contains a prototype XBRL instance using the WIP taxonomy which includes the XBRL formula file. I am still working on this prototype so check back for even better versions. (If you don't have an XBRL Formula processor, try Arelle.)
Finally, there are three applications I tested this WIP taxonomy prototype in which provide excellent renderings. Click on each of the links below to have a look at each rendering. Notice how the renderings are very readable with no need for Inline XBRL or the Table Linkbase. That is because the renderings leverage business report semantics. For example, each rendering engine understands the difference between a roll up and a roll forward.
For what it is worth, I have provided similar information but with no real explanations of what I was providing in the past. Here is a reference implementation of an XBRL-based public company filing to the SEC. That shows the interrelations between the fragments of a financial report. Here are some smaller report fragments of what such a report might contain.
XBRL-based business rules using XBRL Formula will very likely be the mechanism used to articulate and rearrange the abstract symbols of financial reports in the future. Understanding this now will provide you with an advantage.
Understanding machine-readable business rules will be critical for professional accountants when digital financial reporting takes off. Don't be left behind.