My last blog post shows how to leverage the power of XBRL Formula to express business rules. In this blog post I will show lot to leverage the power of XBRL definition relations to express business rules.
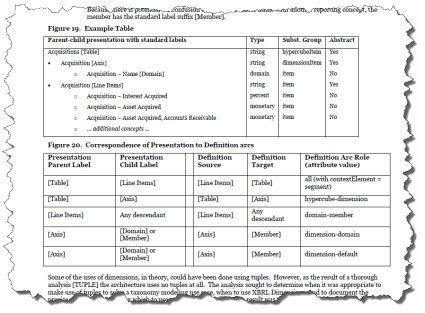
One of the common mistakes people make when working with XBRL is in configuring their XBRL presentation relations appropriately. The FASB understands this issue and on page 24 of this document, section 4.5 Implantation of Tables, they explain, sort of, how [Table]s should be configured.
What do I mean by "sort of"? Well, three specific things.
- The explanation provided is not complete nor precise.
- The explanation does not include representing information when [Table]s are not used.
- The explanation is in human readable form, but not in machine-readable form.
These three issues cause problems in how public companies organize their presentation relations in their XBRL-based financial reports. I took the proprietary approach that I originally used and converted that proprietary approach to an XBRL definition relations based approach. I will walk you through how I did that in the following paragraphs.
First, you need to understand that all of the elements in the XBRL presentation relations can be distilled down into one of the following categories: Network, Table (or hypercube), Axis (or dimension), Member, Line Items, Concept, and Abstract.
Second, you need to understand as the FASB tries to point out in their US GAAP Financial Reporting Taxonomy Architecture document that there are allowed and disallowed relations between each of those categories. For example, a [Member] is never related to a [Line Items]. You can express the allowed and disallowed relations in the form of a human-readable matrix:
 (Click image for a larger view)
That matrix provides more clarity between the allowed and disallowed relations between the categories of report elements within XBRL presentation relations. It is also complete and covers when there is a [Table] (hypercube) or when there is not.
Don't make the mistake of focusing on the specific rules and whether a relation is or is not allowed. That is not the point, that can be a little subjective. The point to focus on is that the matrix provides a complete set of the allowed/disallowed/not advised relations. You can set them however you might desire.
So providing the matrix alone is helpful. That matrix is understandable by humans. But the matrix is not understandable by machines. What if you put that information into machine-readable form? How would you do that? Well, here is how you do that.
First, you have to define a set of XBRL arcroles that define the type of relations you want to work with. I did that here in this XBRL taxonomy schema. If you want to look at those, see the last three arcroles which define the three types of relations: allowed, disallowed, and not advised. That matches the information in that matrix.
Next, I articulated the different relations using XBRL definition relations. You can see that XBRL definition relations linkbase here. Essentially all the linkbase does is articulate relations between the categories of report elements using the arcroles which were defined.
To make the XBRL presentation relations easier to process, the XBRL presentation relations are converted to an easier to read XML infoset. I could do that, but I rely on a web service provided by XBRL Cloud. Here is that XML infoset that shows the relations in an easier to read form. Here are those same relations in human readable form. (If you want to see the XBRL presentations that I am using, here are those.)
Then, I created an application using Microsoft Access to process the XML infoset file and accumulate information about how the elements are related to one another. Here is that VBA code so you can get an idea of what I am doing.
The code looks at the XML file, looks at the allowed relations (which I hard coded, but you could make this dynamic by reading the XBRL definition relations), and then generates a table of the evaluated relationships. I then format the table which is readable by humans and looks like this:
Note that there is no RED or ORANGE cell that has a value other than "0". That means that the XBRL presentation relations follow the rules defined in the XBRL definition relations file.
So, that is only ONE example of the sorts of relationships you can express in global standard XBRL definition relations. A while back I provided another example that evaluates other sorts of relations related to disclosures.
When you combined XBRL Formula based business rules and XBRL definition relations based business rules, that is a lot of expressive power at your disposal in a global standard format. And to the extent you can express information, machine-based can be used to automate work performed by humans. Not all business rules you might want to express can be automated, but a lot can.
When you do this, you have to pay attention to not induce logical catastrophes that cause your rules to fail/crash.
At the time XBRL was being created everyone agreed that XBRL definition relations where very powerful. The XBRL Link Role Registry(LRR) was created to allow for new global standard relations to be created.
Just because most people do not understand the power of XBRL definition relations does not mean that they are not powerful. When you combine the power of XBRL definition relations and the power of a properly implemented XBRL Formula processor, a lot of functionality becomes available to the business professionals who use these global standard tools.

