Getting from Fact Table to Human Readable Rendering
This is the third installment of three blog posts which go together. The first to help you understand this third post. The first blog post helped you see that [Axis] articulate characteristics of a fact and that you can organize a set of facts into a fact table. The second blog post builds on the first, helping you to better see how fact tables work.
The final piece of this puzzle is turning that fact table into something useful to a human. This process is detailed in this document, From Fact Table to Rendering. Below I will summarize the key points (and I am not showing all the graphics, see the PDF for those).
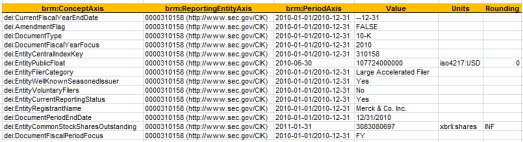
Step 1: Basic Fact Table. Here we have a basic fact table. (If you don't understand this, please go back and read the two blog posts which are pointed out above.)
The facts are in the rows. The [Axis] are in the columns. The Value is the value of the fact, the units show the units of the value if the value is numeric (most people don't consider this an [Axis], some do), and the rounding explains how many decimal places the fact has. For the purposes of this exercise we will ignore the units and rounding.
Step 2: Identify Slicers. A slicer is an [Axis] which has the same value or [Member] for each fact. For example, the ReportingEntityAxis and the LegalEntityAxis is the same for each fact. What we do with slicers is move them in the upper left hand corner (using my rendering model).
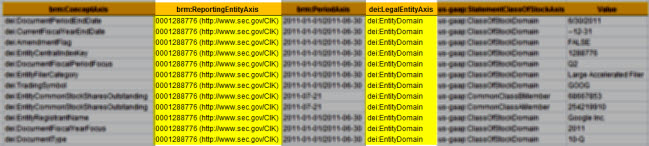
Step 3 Repositioned Slicers. In the PDF you can see the repositioned slicers. Basically, the slicers apply to each of the facts and they are the same for each fact. Slicers serve another role which is to filer facts, but we won't get into that here.
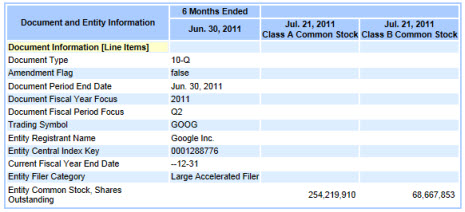
Step 4 Identify Columns. The next step is to identify the columns of the rendering. Different portions of a report have different conventions for rendering. You could render or present the information however you like. But conventions are good because they help software pick an appropriate option if options exist. So, we will follow the SEC interactive information viewer convention as it will meet our needs here. We look at the two [Axis] with the SEC put into the columns, the period [Axis] and the class of stock [Axis]. The colors show the different values or [Member]s for these [Axis].
Now, this would be a lot easier if there were only one [Axis] which went in the columns, but I wanted to show to so you can get an appreciation for how to think through this process. Also note that you have two concept [Axis] which are the same and have the same period; the only differentiator is the class of stock [Axis].
Step 5 Rendered Columns. Without trying to overdue the explanation, this is what the rendering of the columns look like (see the PDF) for the first iteration where each of the two [Axis] is placed in the column heading, and the values which have those characteristics are placed in those columns for the rendering.
Step 6 Organize the Rows. Next we order the rows. We could do that alphabetically, we could use the taxonomy presentation order, or we could frankly use whatever ordering you wanted; the easiest and what the SEC viewer uses is the taxonomy order.
Step 7 Tidy Things Up. And finally we tidy things up by pulling the "Document Information [Line Items]" concept from the taxonomy to hang the other concepts off of (providing organization), we grab the taxonomy labels because they are easier on the eye than those names, use whatever other colors we want, format to your heart's content.
Step 8 Leverage Information model. For some renderings understanding the information model helps you get the correct rendering. A good example of this is the roll forward. Different XBRL rendering engines leverage the information to a greater or lesser degree. The PDF shows a well rendered roll foward, and a Firefox add in rendering which is not that great. The SEC viewer understands how a user typically wants to view the roll forward information model and the Firefox add in does not, thus the funky rendering.
Most rendering engines get the roll up and hierarchy information model metapatterns correct, but not the roll forward or other information model metapatterns.
For more known metapatterns see: http://secxbrlglossary.wikispaces.com/Information+Model
So that is how we get to this:
Not too bad.
A good question to ask yourself might be why can't the rendering within a creation tool look similar to this, basically allowing you to create or edit something like an SEC XBRL financial filing in a "what you see is what you get (WYSIWYG) style? I am NOT talking about editing HTML and then tagging that HTML with XBRL. I am talking about not even needing to "tag" anything. There is no tagging.
In a future post I will discuss semantic structured model-based authoring of financial statements and why you want that.
 Charlie
 Post a Comment
 View Printer Friendly Version
 Email Article to Friend
Reader Comments