New Approach of Testing Public Company Conformance to Fundamental Accounting Concepts and Results
I have been testing conformance to a set of fundamental accounting concepts using the same approach for almost a year now. These blog posts summarize those results:
- March 3, 2014: One set of fundamental concepts, working prototype
- September 22, 2014: One set of fundamental concepts, commercial product
- October 19, 2014: One set of fundamental concepts, commercial product
- November 1, 2014: One set of fundamental concepts, commercial product
I now have a new approach. The prior approach used one set of fundamental accounting concepts and relations between those concepts for all entities. The new approach groups entities into currently 81 groups and provides a set of fundamental accounting concepts and relations between those concepts. Why? Because that is what the data says.
What are the 81 groups? The groups come from the following reality based on how 6,943 entities report:
- Entities have different accounting/industry activities
- Commercial and industrial (5,985)
- Interest based revenues (632)
- Insurance based revenues (50)
- Securities based revenues (93)
- Real estate investment trust (158)
- Utility (25)
- Entities use different balance sheet formats
- Classified balance sheet (5,527)
- Unclassified balance sheet (1,412)
- Liquidity based balance sheet (4)
- Entities roll up net cash flow on their cash flow statement differently
- Exchange gains (losses) part of net cash flow or does not report line item (6,845)
- Exchange gains (losses) part of cash roll forward (98)
- Entities use different income statement formats
- Single step income statement (4,255)
- Multi step income statement (2,688)
- Entities report Income (loss) from equity method investments in different locations on their income statement
- Income (loss) from equity method investments not reported (5,290)
- Income (loss) from equity method investments reported BEFORE tax (1,402)
- Income (loss) from equity method investments reported AFTER tax (113)
- Income (loss) from equity method investments reported within nonoperating income (loss) (122)
- Income (loss) from equity method investments reported within revenues (16)
- Income (loss) from equity method investments reported between income (loss) from continuing operations before and after taxes (0, not working yet)
- Some entities report operating income (loss) as a line item while others don't
- Operating income (loss) reported (5,120)
- Operating income (loss) not reported (1,823)
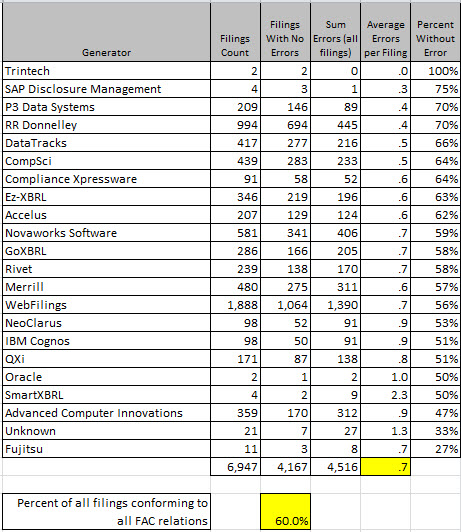
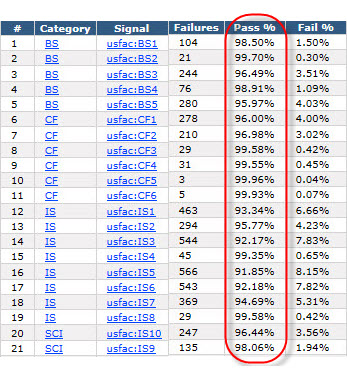
These may not be totally correct yet...but they will be eventually. Probably soon. The amazing thing is that when I switched from the single set to the multi-set or what I call a report frame based approach, I did not break anything as far as I can tell. This is how the data sorts out now by generator:
 (Click image for larger view)
So, the last results I provides showed that 63.1% of entities passed all conformance tests, that dropped to 60.0%. I don't think that is because quality is going backwards, it is because my testing is getting better based on feedback I am receiving.
There is another thing that I want to point out. The total number of nonconforming items is 4,516. I would break that down as follows:
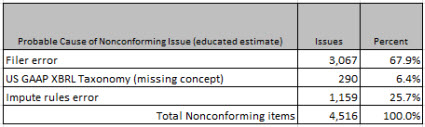
Most issues can be proven to be filer error, 67.9% approximately. 290 or so appear to be cause by missing US GAAP XBRL Taxonomy concepts. And the remaining 1,159 are likely caused by bugs or errors that I still have in my process (in the mapping rules or in the impute rules, this is still a work in process). So basically the point is that why filers don't conform can be explained.
I also want to point out this to put things into perspective. If you look at the two graphics below you can see that while 4,516 nonconforming items exist you will also note that by one measure 349,781 conforming items exist and by another measure 141,371 conforming items exist:
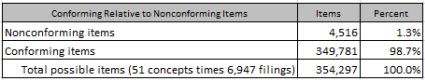
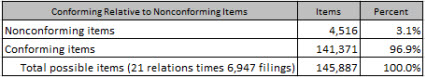
So basically, somewhere between 96.9% and 98.7% of all fundamental accounting concept relations are conformed to and 60% of all reporting entities conform to 100% of these relations currently.
And there is one final graphic I want to show you. This is the summary of conforming/nonconforming items as shown from the commercial software product that I am using to evaluate public company financial statements against these fundamental accounting concept relations:
I realize that this is a lot of information. When people talk to me I commonly get the feedback that they feel like they have a 4 and 1/2 inch fire hose shoved into their mouth. So here is information that you can read about that puts all these pieces together for you. Read it at your own pace.
Trust me, this is important information. But while this is important to understand, stay tuned to understand what it all means.
Oh, almost forgot. Here is the comparison of the analysis periods.
 Charlie
in Becoming an XBRL Master Craftsman
|
Charlie
in Becoming an XBRL Master Craftsman
|
 Post a Comment
 View Printer Friendly Version
 Email Article to Friend
Reader Comments