Understanding the Power of XBRL Graphs
Graphs are amazing little tools. When I say graphs, I mean the graph theory definition of a graph which is "structures used to model pairwise relations between objects". And in writing that, I don't know if it is the graphs that are amazing or if it is the formats used to represent graphs which is amazing.
This is what I mean.
RDF is an approach to expressing things using a graph-type format. Basically you represent what amounts to a flat list of stuff and then software which processes RDF organizes the flat list of stuff into relationships generally displayed in the form of a "tree". This offers a lot of flexibility.
Well, XBRL does the same thing. Or rather, XLink does the same thing and XBRL leverages XLink so in that way XBRL can express graphs. XBRL presentation relations, calculation relations, and definition relations are graphs.
So here is a very basic example. Below is a "tree" which represents information about financial reporting topics expressed using XBRL. This is the XBRL definition linkbase which expresses those relations.
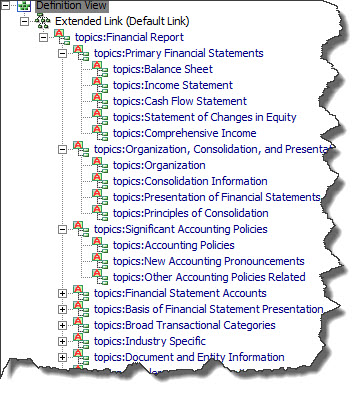 Topics
If you go look at the XBRL definition relations you will see that there is a flat list of stuff. The XBRL processor takes that flat list and renders a human readable view of the information.
So here is another set of XBRL definition relations which have information about financial reporting topics and also has information about financial disclosures. The disclosures refer to the topics in order to organize the disclosures into the related topic. (Here is the XBRL definition relations for the topics and disclosures.)
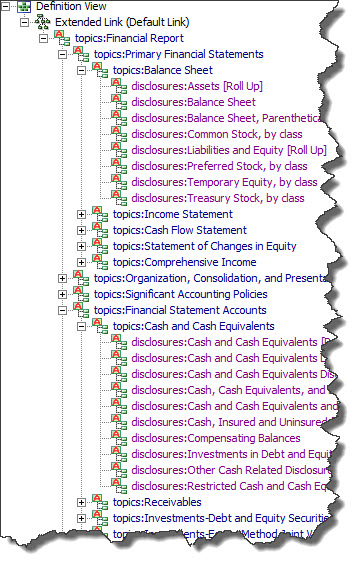 Topics plus Disclosures
So basically, the list of topics and the list of disclosures are combined into ONE list. (Bear with me for a moment here.)
OK, so here is another list I created. This is interesting for two reasons. First, notice that the information is flat. Second, that is actually not just one XBRL definition linkbase. That is a set of about 221 XBRL definition linkbases which are combined together using this XBRL taxonomy schema. (Here is one example set of business rules, I will explain those in another blog post.)
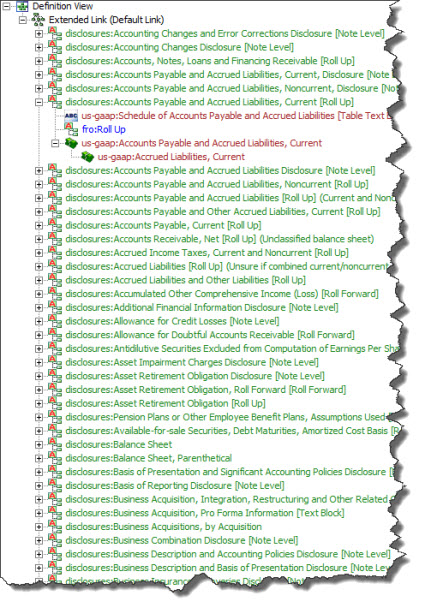 Business rules
This is where things get really interesting.
Below you see the financial reporting topics, the financial disclosures organized by topic, and then the business rules that I created organized by financial disclosure. I put all those pieces together with this XBRL taxonomy schema. For good measure and so I can read the information using labels rather than just element names, I added the US GAAP XBRL Taxonomy and DEI Taxonomy labels.
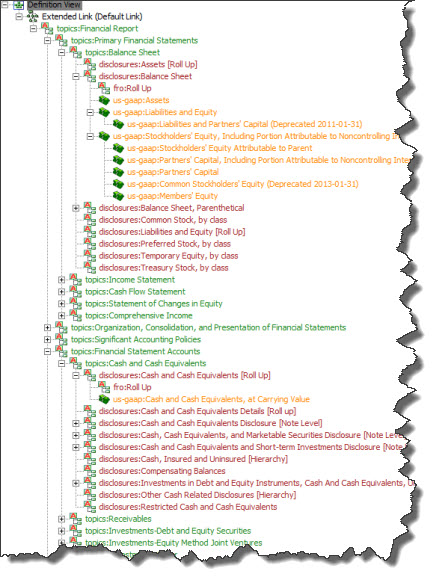 Topics, Disclosures, Business Rules
Because I organized the information correctly and paid attention to the extended link roles I used, all of these pieces are merged into one graph by the XBRL processor which displays that information. XBRL was designed this way in order to provide the extensibility which was required as a feature. Here you see that feature in action.
That may not seem like much, but when you think about it the utility of this starts to make sense. Ever try and merge to XML hierarchies together? There is no standard way to do that. You can physically merge two hierarchies of things, but someone has to write code to make that happen on a case-by-case basis. Same deal with combining two relational database tables. You can do it, but there is no global standard way to do it and you have to again combined things on a case-by-case basis. XBRL (via XLink) and RDF both allow for this type of flexibility.
But wait, there is even more! XBRL has two additional useful features. I don't think that RDF has either of these, but I need to check some more to be sure. The first is the ability to partition graphs into different networks. What this allows is different sets of things which can never collide. Networks basically keep sets distinct. I think you can achieve this using RDF by physically separating information into different files.
The other feature is prohibition. Say you don't like a relation which has been expressed. Well, XBRL allows you to turn the relationship off by prohibiting the relation. XBRL basically provides and "audit trail" so to speak so you can track the expression of the relation, if someone turned the relation of, and then even if someone recreated the relation. Of course, the system making use of XBRL can allow or disallow prohibition. (Here is a prohibition example I created.)
The bottom line here is that graphs offer flexibility and XBRL can articulate graphs of information. The way most others use XML, they cannot do this and there is certainly not a global standard way to do this, each case is therefore a point solution which requires someone writing code. Same for relational database tables, particularly across systems.
 Charlie
in Becoming an XBRL Master Craftsman
|
Charlie
in Becoming an XBRL Master Craftsman
|
 Post a Comment
 View Printer Friendly Version
 Email Article to Friend
Reader Comments