Understanding Financial Report Knowledge Graph
Fundamentally, XBRL is a technical syntax that lets you create a "graph" of knowledge, a knowledge graph, for a financial report. What is interesting about XBRL is that each piece of the knowledge graph are rather simple but those pieces can be strung together to create something quite complex such as a 10-K financial report.
Here is a non-standard technical oriented "pointer" to the pieces of a knowledge graph for US GAAP. It is just a list of files that you can look at.
You take specific fragments of that knowledge graph, association them with an XBRL-based financial report, you load all that into a tool that understands the XBRL technical format and you get something that looks like this: (click the image for a larger view, or see this web page)
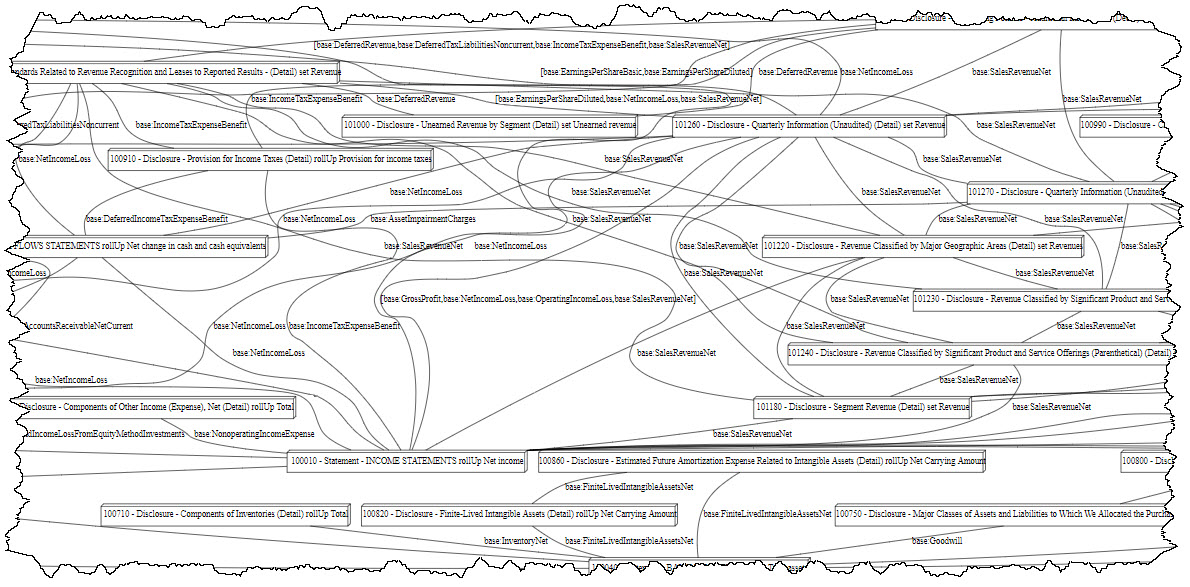
Now, that is a lot of information but that information is not really that useful in that form. Working with that information would be like working in computer assembly language.
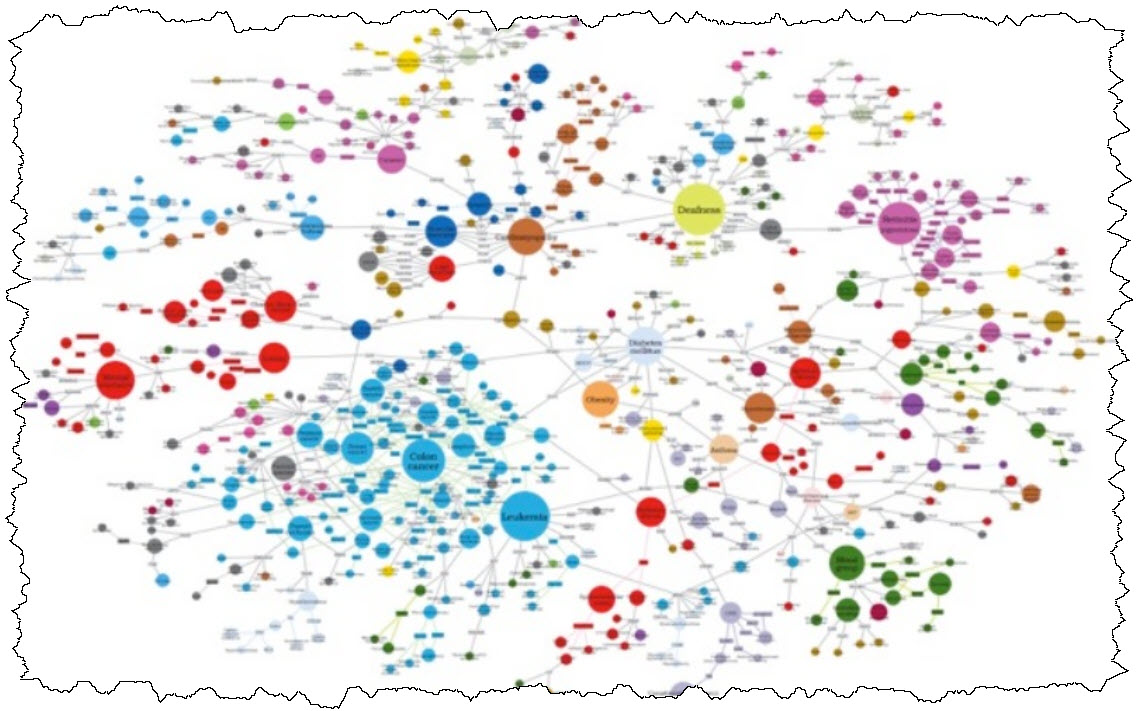
But there are tools for working with graphs of knowledge. One of those tools is Neo4j. Here is a small financial report knowledge graph converted from XBRL into Cypher (the syntax of Neo4j) and then loaded into Neo4j. Note the coloring, the sizing of the nodes, etc.:

A more sophisticated financial report might look like the following in Neo4j:
But Neo4j is still a general tool for viewing and working with any knowledge graph. While very useful using, say, a tool like Neo4j's Bloom graph visualization and exploration tool, it is still a general tool and it only gives you general views of a knowledge graph.
But what if you could take that XBRL-based knowledge graph and load it into a tool that was specific to financial reports. That would look something like what you see below:
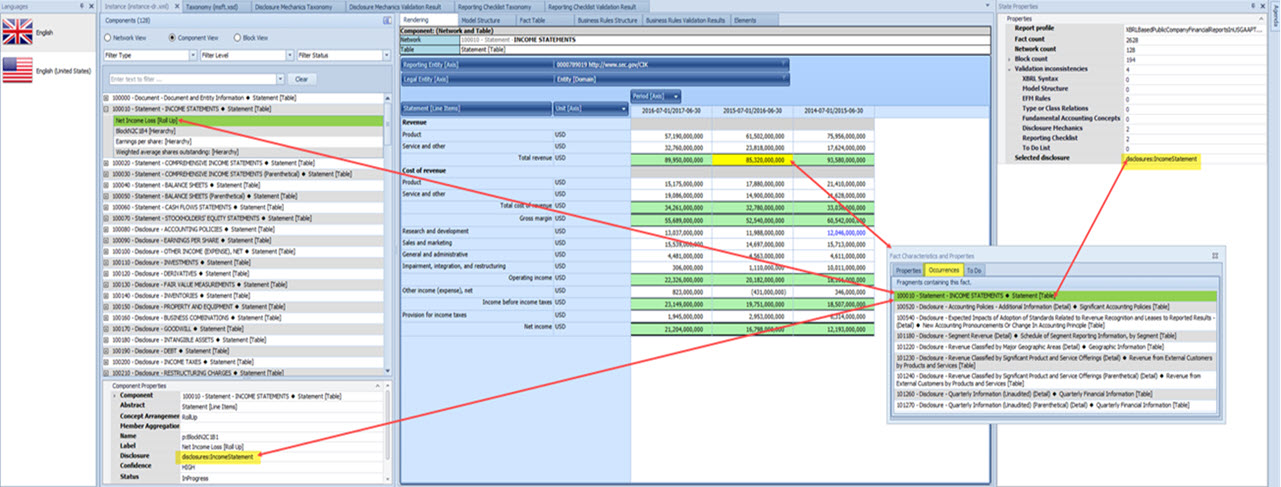
That is the difference between a "general" tool that will work for any area of knowledge and a "specific" tool that is specialize for one specific area of knowledge, in this case financial reporting.
That is the difference between a general tool like Neo4j or Vaticle (was called Grakn) or TopBraid Composer and specialized tools for financial reporting like Pacioli or Pesseract or XBRL Cloud's Evidence Package.
What turns a general tool into a specialized tool? A machine-understandable model. That is why the Logical Theory Describing Financial Report is so critically important. That high level model turns generalized knowledge graphs into specialized knowledge graphs. General tools are not very approachable to business professionals. But specialized tools are very approachable.
You can work at the level of computer assembly language. But why would you?
#############################
 Charlie
in Digital Financial Reporting, Knowledge Graphs
|
Charlie
in Digital Financial Reporting, Knowledge Graphs
|
 Post a Comment
 View Printer Friendly Version
 Email Article to Friend
Reader Comments