Digital Business Report: Cross Between Spreadsheet, Pivot Table, and BI
This blog post is another attempt to communicate how a digital financial report will work. This is a prior attempt. This update uses information from this blog post also.
A hypercube is table which can have any number of dimensions, or "n" dimensions. A cube has three dimensions. A tesseract has four dimensions. The more dimensions you have, the wilder the visuals get.
While the number of dimensions can be larger than two dimensions; a spreadsheet is limited to visualizing only two physical dimensions at a time because of the limitations of physical space: columns and rows which intersect at a "cell". But imagine a spreadsheet which can do this:

To understand how visualizing information that has more than two dimensions might work; one must first decompose the information into its components.
First off, the term dimension is a technical term used to represent a characteristic of a piece of information for unambiguous interpretation. A dimension is technical approach to articulating a characteristic.
A characteristic (or distinguishing aspect) provides information necessary to describe a fact or distinguish one fact from another fact. A fact may have one or many distinguishing characteristics.
A scalar is a piece of information which has no characteristics, it stands on its own. A scalar does not need to be characterized. For example, the value of pi is a scalar, it never changes; it always has the same value for everyone. (Pi is the ratio of a circle's circumference to its diameter and always has the value of equal to 3.14)
Visually, this is what a scalar looks like:

A list has only one physical dimension. For example, the following is a list of numbers. But you don't know any more about the characteristics of the number. You don't know if the number is for, say, revenue, net income, assets; you don't know if the number is in US Dollars, Euros, or Yen; you don't know if the number is for Microsoft, Apple, IBM, or some other company. All you have is a list of numbers:

A table has two physical dimensions: rows and columns which intersect to form cells. A spreadsheet is a good example of presenting a table. Other terms used for table are matrix and array.

A table (spreadsheet, matrix, array) can have any number of rows and columns (or, to the limit of the software application; Excel for example does have limits).
So a table can hold pretty much any set of information and the characteristics which describe the information. But as the number of characteristics, rows, and columns increases; it gets harder and harder to work with the information. Also, if you are working with DIFFERENT tables which have different dimensions/characteristics things get more challenging.
This is why relational databases are so handy. Relational databases store information in the form of tables which can basically hold anything. But as the shapes of the tables change, it gets more and more challenging to put things into relational databases or manage all the things you have in a relational database. As new tables are received, the relational database schema needs to be changed.
Here is a small table with a value and four characteristics which conceptualize the value in the column "Fact Value" or "Fact". A fact is equivalent to a cell. A fact defines a single, observable, reportable piece of information contained within a business report, or fact value, contextualized for unambiguous interpretation or analysis by one or more distinguishing characteristics:

A cube can be thought of as a three dimensional presentation of a table/matrix/array. "Space" has three dimensions. Paper only has two dimensions though. You can present three dimensional information on the two dimensional medium of paper by grouping information and printing one group, then the next, then the next linearly down the piece of paper. The software application Excel achieves three dimensions by adding the notion of a "sheet". In the old days of spreadsheets there was only one sheet. But today, Excel has the notion of a "workbook" which contains "sheets" which then contain rows and columns which intersect and form cells.

A pivot table is an approach to visualizing a table of information which has more than two dimensions. There are two things going on with pivot tables. The first is the number of characteristics a value has and the second is how to show all of the information, including the characteristics, in usable ways. So you have both the information that you are dealing with and how to present the information. Again, a computer screen only has two dimensions, it is flat. It can be a challenge to render information which has more than two dimensions in a two dimensional space. A pivot table is one way of achieving that goal.

As was said above, a hypercube is an "n" dimensional table/matrix/array. Where "n" represents any number of dimensions or characteristics. And so every table is a hypercube. Different tables or hypercubes can have different numbers of characteristics. It is easy to work with tables that have exactly the same characteristics or dimensions together. The more different the dimensions/characteristics, the more challenging it is to put different tables/hypercubes together.
Saying this another way, different tables/hypercubes have different shapes.
The more dimensions or characteristics that a hypercube has, the more challenging it is to rendering that information in two dimensional space such as paper or a spreadsheet. Computers can be better for presenting this sort of information to humans in readable forms because computers can be dynamic, like a pivot table.
In today's spreadsheets, the cells of the intersections of the rows and columns of a spreadsheet are created by the physical rows and columns. Rows and columns are basically numbered. But what if the rows and columns were connected together not by physical rows and columns, but by meaning. What if the characteristics of the information glued cells together into rows and columns?
This is mental leap, but image the cells laid out flat (graphic below), but then a software program grabs the appropriate information based on the relations between the cells; grabs the appropriate business rules based on the type of concept arrangement patterns (roll up, versus roll forward, versus adjustment, versus hierarchy), member arrangement patterns (whole-part relations such as member-collection); grabs information related to common approaches to rendering and formatting information; and then put all of those pieces together to provide a human-readable rendering.
And so, you go from something that looks like this:
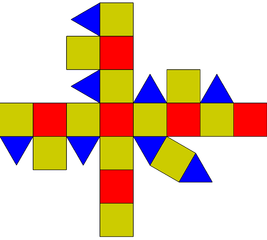 http://en.wikipedia.org/wiki/RhombicuboctahedronTo something that looks like this using all of that metadata:
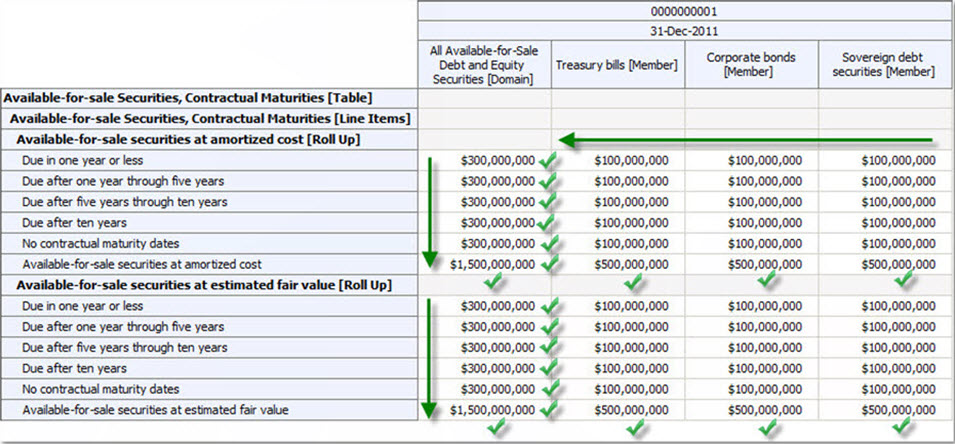 (Click image for larger view)You can show, or not show, the green checks if the roll ups actually roll up. If they don't roll up, you show red X's or something.
But you not only get great human readable renderings, you also get to pivot the renderings to render information the way you want it shown and formatted without rekeying the information into a different spreadsheet. As you pivot information, the renderings are always readable by humans because the pivot table understands the difference between a roll up and a roll forward. You can drag and drop spreadsheets to compare information from separate documents such as separate financial reports.
Imagine an application which is good at handling n-dimensional information (i.e. any number of dimensions or characteristics). Consider this visualization of a four dimensional object or hypercube:
Or this visualization of a five dimensional hypercube:
A pivot table is one example of that sort of application. Image an electronic spreadsheet/pivot table type application which:
- Is a global standard (such as XBRL)
- Hypercubes can be edited by business users
- Supports common computations including roll ups, roll forwards, adjustments, variances
- Information is glued together with business rules and the business rules are just as exchangeable as the information itself (i.e. the metadata is part of the information)
- Information is exchangeable between any business system (not limited to your internal silos of information)
- Supports OLAP, but does not require OLAP to be used
- Supports both numeric and textual information
- The pivot tables are read/write
- Is easy to query because the metadata used to glue the information together is understood by the query engine
No such software exists today with all of these features. However, each of these features does exist. The SEC Interactive Data Viewer renders a lot of information nicely; but it is actually not that great of a rendering engine and the renderings are not pivotable, they are not dynamic. The XBRL Cloud Viewer (click on "Viewer" in the Interactive Reviewer column) renderings are pretty good and they are dynamic; but they are read only. Neither of these let you perform the simple task of querying across filings, but the SECXBRL.info API will let you do that. Other applications exist which have some of the above features; but no application exists with all of these features.
But what if the application did exist? What if the application had a high reasoning capacity because it interacted with the metadata appropriately.
What if you added an additional layer on top of that application which was specific to financial reports. Then, the digital business report because a digital financial report, simply by adding another layer of metadata. Basically, there are three layers:
- XBRL processor: handles the technical syntax layer, makes sure the syntax conforms to the XBRL technical specification.
- Business report processor: handles the business report layer; makes sure the model structure is intact, makes sure that roll ups actually roll up, roll forwards acually roll forward, other things that all digital business reports have in common.
- Financial report processor: If the business report is also a financial report, another layer exists to make sure the report conforms to the rules of a financial report; the fundamental accounting concepts are intact; the report frame is intact; the disclosure checklist is complied with; all this is done by leveraging financial report specific metadata.
What exactly prevents this application from being created?
 Charlie
 Post a Comment
 View Printer Friendly Version
 Email Article to Friend
Reader Comments