XBRL Taxonomy Creator Prototoype Shows Real Time Validation
I created a working prototype XBRL Taxonomy Creator software application using Microsoft Access. You can DOWNLOAD a ZIP archive containing the Access application and run it for yourself (requires a Microsoft Access license or for you to download and install the Microsoft Access runtime.)
You can see how this XBRL taxonomy creator prototype works by watching this video. If you watch the video you can see how to use the application, but it really is pretty simple.
Here is my point. The US GAAP XBRL Taxonomy Architecture, section 4.5 Implementation of Tables dances aroundthe idea but does not specifically state that (a) the report elements of an XBRL taxonomy fit into categories and (b) those categories of report elements have specific, allowed relations. By "dances around" I mean that they are not explicit.
But I am being explicit. EVERY report element that is used to define the structure of an XBRL-based report fits into exactly one of the following categories:
- Network (or called BASE SET by Edgar Filer Manual and GROUP by US GAAP and IFRS XBRL Taxonomies)
- Hypercube (or called Table by US GAAP and IFRS XBRL taxonomies)
- Dimension (or called Axis by US GAAP and IFRS XBRL taxonomies)
- Member
- LineItems (or called Primary Items by XBRL Dimensions)
- Concept
- Abstract
Those categories of report elements can be related to one another per this matrix that I created (NOTE that my matrix is far more strict than what is allowed by the SEC, I also have a matrix that matches the SEC allowed relations.
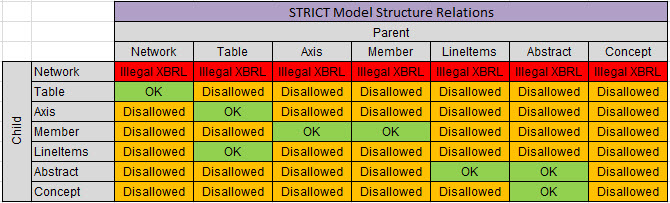 (Click image for larger view)
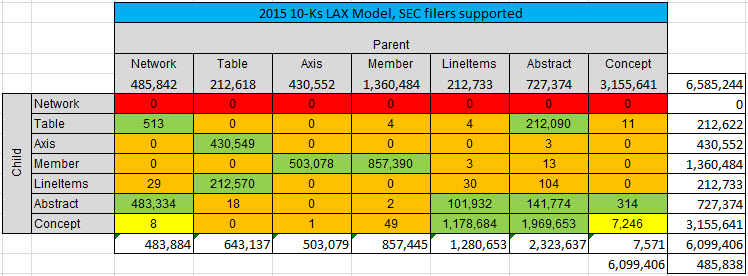
So, what does the SEC allow? Well, here is my measurement of the relations from the 2015 10-Ks which is pretty darn good empirical evidence as to what is allowed: (the numbers show the actual numbers of the report elements and the relations between the report elements.
 (Click image for larger view)
GREEN is what is allowed, RED and ORANGE are clearly disallowed, and YELLOW is somewhat questionable but looking like they should be DISALLOWED. For example, the number of CONCEPTS that had other CONCEPTS as children went form 13,346 in 2013 down to 11,391, and is now at 7,246. So the evidence seems to point to the idea that this is not really a good idea. What exactly does it mean for a CONCEPT to have another CONCEPT as a child in a model?
You can distill that matrix into machine-readable information such as this set of XBRL definition relations which represents the SEC version of the allowed relations. And that, my friends, is how you can get software to verify these relations to make sure you are always following the rules.
Now, because I am not a programmer and because these rules rarely need to be modified; I hard-coded the rules in my Microsoft Access Database Application. XBRL Cloud has been using these model structure relations rules for several years on their EDGAR Dashboard. Notice the column "Model Structure Rules" and how that column is mostly GREEN. This is because people are following the rules because I have been sending them information about violations so they can fix their software.
But this is all done (a) in batch mode and (b) after the report is created.
Now notice my application. Notice that the validation is done IN REAL TIME as the XBRL taxonomy is being created! The software does not let you make mistakes!!! How useful is that?
Why is this important? Well, it is important for the following reasons:
- Leverage: Simply by either assigning or identifying the patterns you are working with such as the categories of report elements; software engineers can be provided with leverage. If they don't understand that these categories exist or cannot figure it out; you get harder to use software with less functionallity because they have to work with the XBRL technical syntax level.
- Ease of use: Because the software application watches over the user of the software, the user of the software does not have to deal with the technical details of creating XBRL. Notice that you never get asked about subsitutionGroup attributes or extended link values. All the technical stuff is hidden.
- Quality control: Real time validation is not limited to the model stucture relations that I am using to demonstrate real time validation. Think about the fundamental accounting concept relations, the type/class relations, the reporting checklist, the disclousre mechanics rules that I discuss in this document.
- Automation: Because tools can be easy to use and because software can reliably keep quality high; many processes and tasks related to creating a financial report can be effectively automated.
About one third of of filing agents can already get pretty good quality per my measurements of the fundamental accounting concept relations testing that I do. That is only going to increase and the scope of testing is going to also increase.
There is a feedback loop that you can see in all of this. The more software vendors and filing agents correct errors, the more XBRL-based financial reports are correct. The more XBRL-based financial reports are correct; the more the model of the reports becomes apparent. The more the model of the reports is apparent; the better the report quality.
The model structure relations are pretty basic. When you start getting into understanding the block semantics witihn a report this gets a little more complicated. However, the basic model structure ideas can help you understand the more complex ideas.
All this is about recognizing and leveraging patterns. That is how software works, by leveraging patterns. The more patterns that are intensionally created, the easier all this stuff is. Alternatively, clever and creative programmers can identify patterns and provide useful and valuable functionality to users of software.
Many tasks related to creating a financial report are dull, tedious, monotonous, and repetitious. Repetitious = patterns. Platterns = automation. Automation = higher quality, more timely information, for less cost.
 Charlie
in Becoming an XBRL Master Craftsman
|
Charlie
in Becoming an XBRL Master Craftsman
|
 Post a Comment
 View Printer Friendly Version
 Email Article to Friend
Reader Comments