BLOG: Digital Financial Reporting
This is a blog for information relating to digital financial reporting. This blog is basically my "lab notebook" for experimenting and learning about XBRL-based digital financial reporting. This is my brain storming platform. This is where I think out loud (i.e. publicly) about digital financial reporting. This information is for innovators and early adopters who are ushering in a new era of accounting, reporting, auditing, and analysis in a digital environment.
Much of the information contained in this blog is synthasized, summarized, condensed, better organized and articulated in my book XBRL for Dummies and in the chapters of Intelligent XBRL-based Digital Financial Reporting. If you have any questions, feel free to contact me.
Entries in XBRL Dimensions Tutorial (1)
Avoiding Poor Representation Choices in SEC XBRL Financial Filings
I was talking with someone about the use of "dimensions" by public companies creating SEC XBRL financial filings. They said something that helped me think of something.
The XBRL Dimensions Specification defines the term "dimension". Per the specification (and therefore how dimensions actually work), a dimension is defined as:
"Each of the different aspects by which a fact MAY be characterised."
What gets people into trouble is they try to use dimensions to both characterize and present information. Take this example:
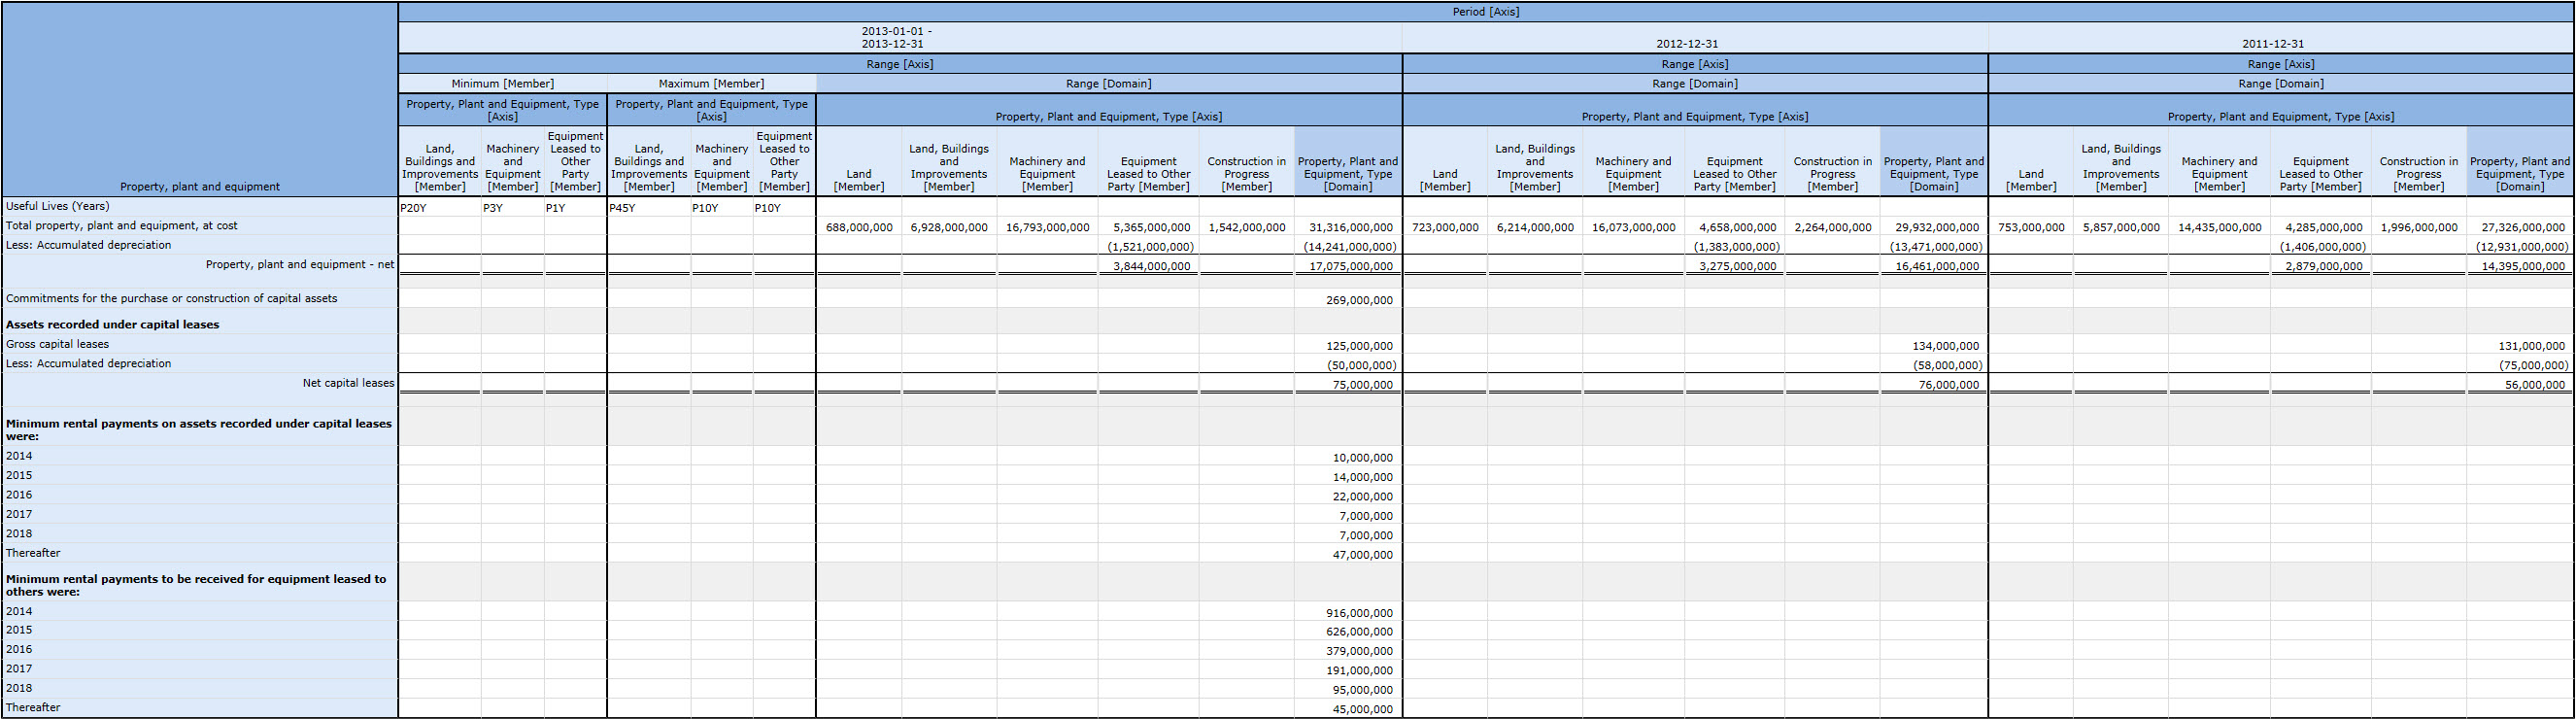 (Click image for larger view)
If you look closely at the image you see a "Range [Axis]". That Range [Axis] characterizes some information, it does not characterize other information.
Contrast the above example to this example: (estimated useful lives)
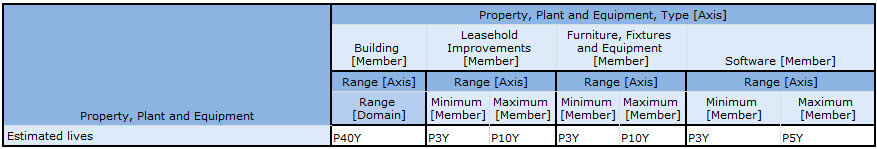 (Click image for larger view)
Notice two things. First, it is very easy to read. Second, there are not any empty cells like in the first example. Third, it is rational and logical and therefore understandable.
And now see this example: (PPE by type)
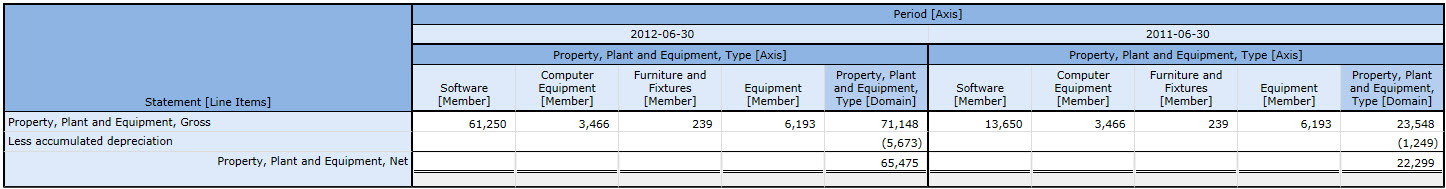 (Click image for larger view)
Same things. Easy to read, some empty cells but not too many, rational and understandable.
And finally, one last example: (minimum lease payments)
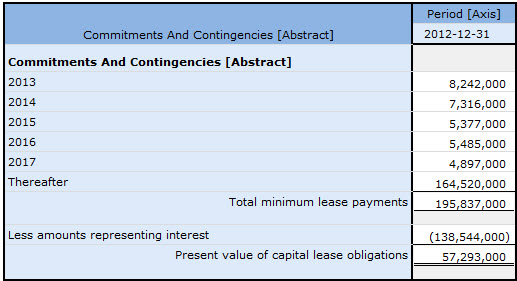 (Click image for larger view)
Notice how if you take that one big thing and break it down into a number of smaller separate things, that everything is readable and understandable. The understanding exists not only for the humans trying to read and use this information, machines trying to read this information also finds the information understandable if it is properly represented.
If a fact cannot be characterized by a dimension or [Axis], that [Axis] does not belong on the fact. That means accountants representing information should not put facts together in the same [Table] (in XBRL Dimensions Specification terminology a hypercube) if they have different characteristics.
 Charlie
in Becoming an XBRL Master Craftsman, XBRL Dimensions Tutorial, XBRL dimensions examples
|
Charlie
in Becoming an XBRL Master Craftsman, XBRL Dimensions Tutorial, XBRL dimensions examples
|
 Post a Comment
|
Post a Comment
|  Email
|
Email
|  Print
Print
