BLOG: Digital Financial Reporting
This is a blog for information relating to digital financial reporting. This blog is basically my "lab notebook" for experimenting and learning about XBRL-based digital financial reporting. This is my brain storming platform. This is where I think out loud (i.e. publicly) about digital financial reporting. This information is for innovators and early adopters who are ushering in a new era of accounting, reporting, auditing, and analysis in a digital environment.
Much of the information contained in this blog is synthasized, summarized, condensed, better organized and articulated in my book XBRL for Dummies and in the chapters of Intelligent XBRL-based Digital Financial Reporting. If you have any questions, feel free to contact me.
Entries in General Information (257)
Comparing XBRL Implementation Alternatives
In order to understand different implementation altrenatives I compared each of the alternatives that I could see using the constraints that I believe are important. This is what I came up with:
There seems to be the following alternative data storage options for implementing an XBRL based system:
- File system: Store information as files in your file system.
- Relational database: Put the data into a relational database.
- Multidimensional database: Put the information into a multidimensional database.
- RDF triple store: Put the information into an RDF triple store.
- NoSQL database: Put the information into a NoSQL database.
There appear to be two different storage strategies which one might use:
- XBRL technical syntax format: Store information in the raw XBRL technical syntax format.
- Queriable semantic oriented format: Convert the XBRL technical syntax into a more queryable semantic oriented format so that you don't need to convert the information at query time, thus hindering performance.
These seem to be the important evaluation criteria:
- Easy for business user to use (intuitive): Is the system EASY or HARD for a business user to use?
- Query power and query sophistication: Is the query language POWERFUL or UNSOPHISTOCATED?
- Performance, query speed: Is query performance FAST or SLOW?
- Expressive power: Is the system EXPRESSIVE or INEXPRESSIVE?
- System flexibility, agility: Is the system FEXIBLE or INFLEXIBLE?
- System scalability: Is the system SCALABLE or NOT SCALABLE?
- Global standard: Is the system STANDARD or PROPRIETARY?
- Cost effective: Is the system INEXPENSIVE or EXPENSIVE?
- Maintainability: Is the system EASY TO MAINTAIN or HARD TO MAINTAIN?
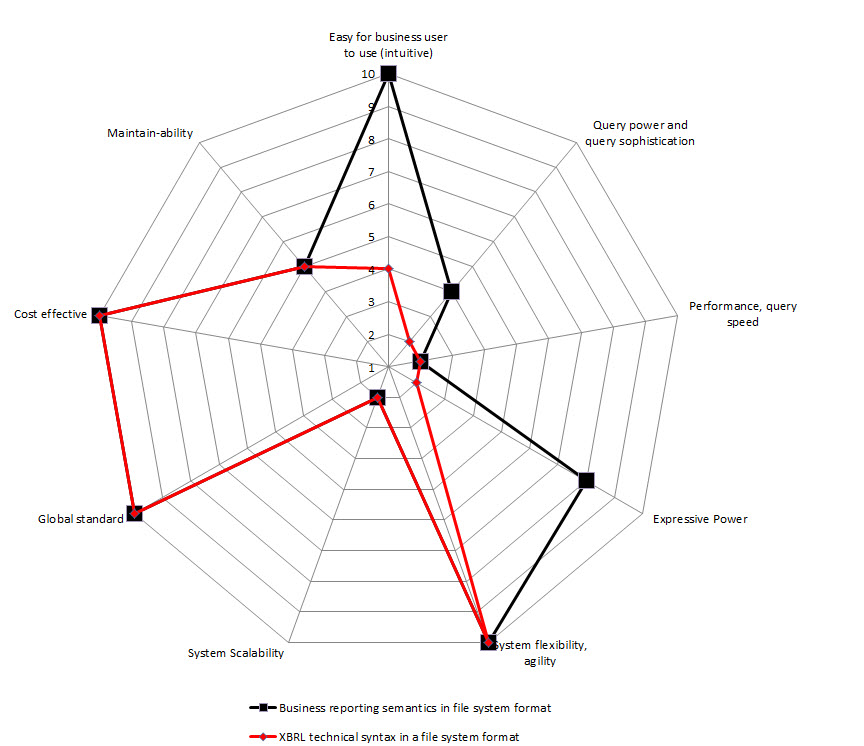
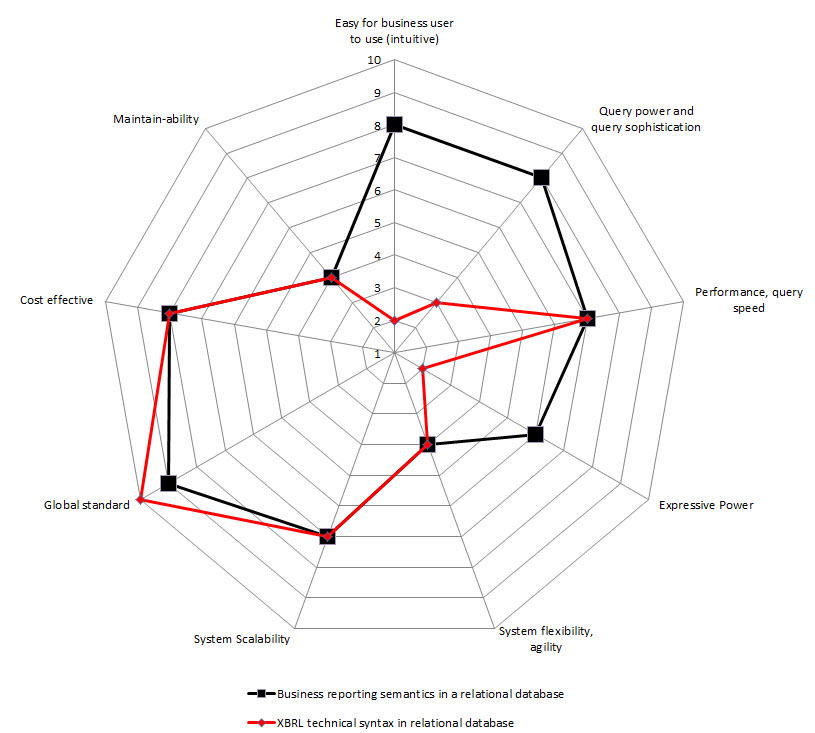
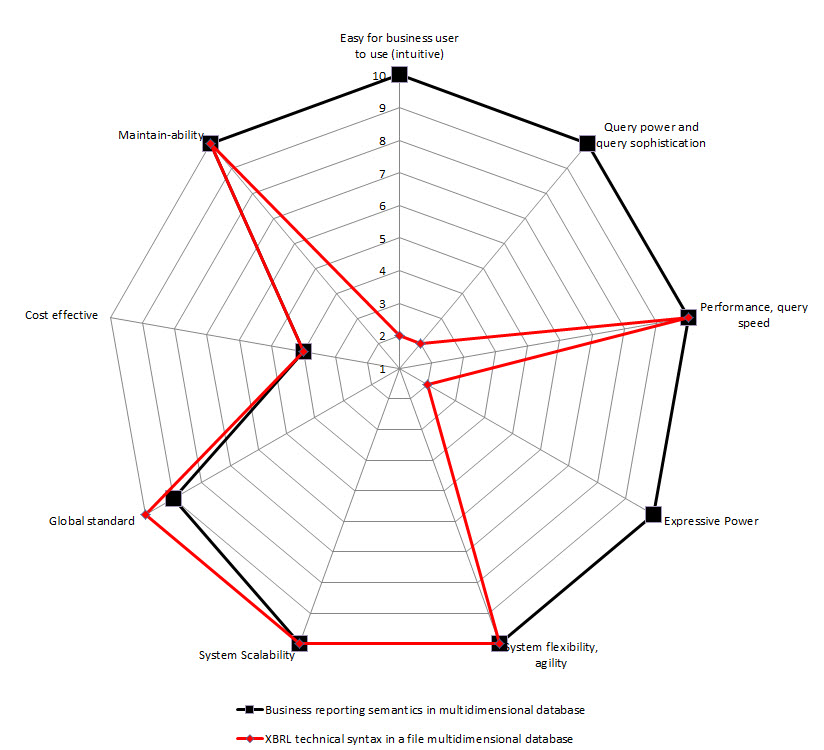
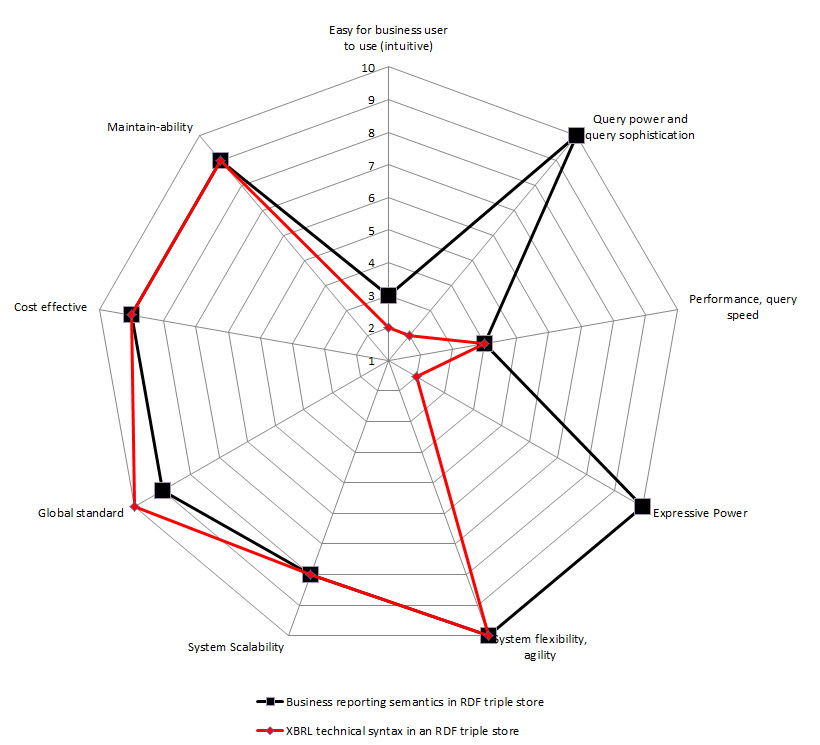
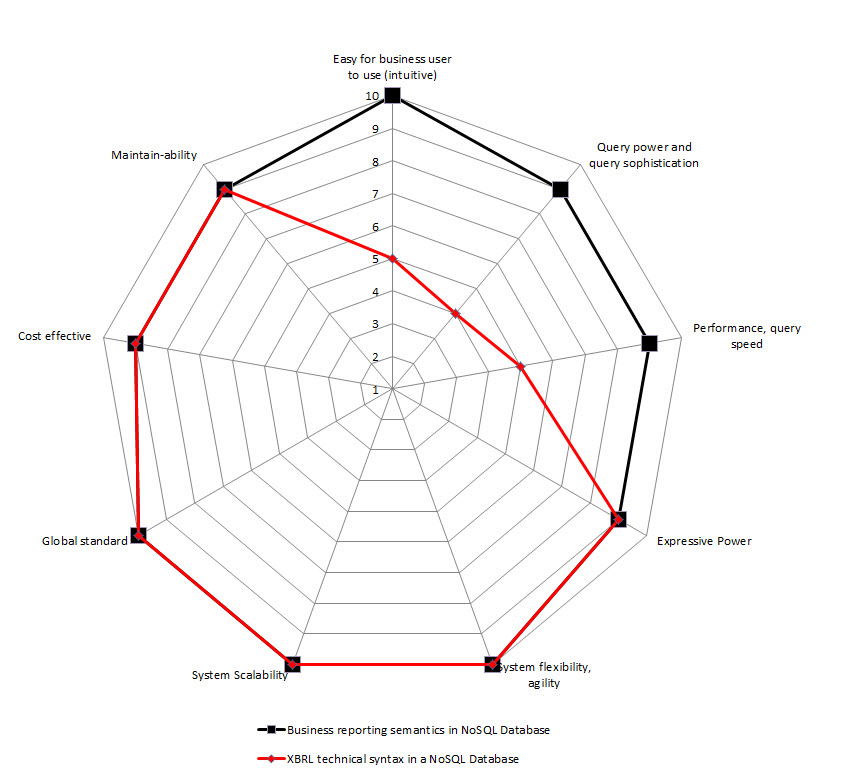
So, I created radar charts for each of the options for implementation from above. On the chart I show two sets of data: one for storing the XBRL technical syntax (in RED), the other for storing a more business semantics oriented format (in BLACK). I assigned values for each of the 9 constraints. The radar graphs below show the results that I get:
File system
 (Click for larger image)
Relational database
 (Click for larger image)
Multidimensional database
 (Click for larger image)
RDF Triple Store
 (Click for larger image)
NoSQL Database
 (Click for larger image)
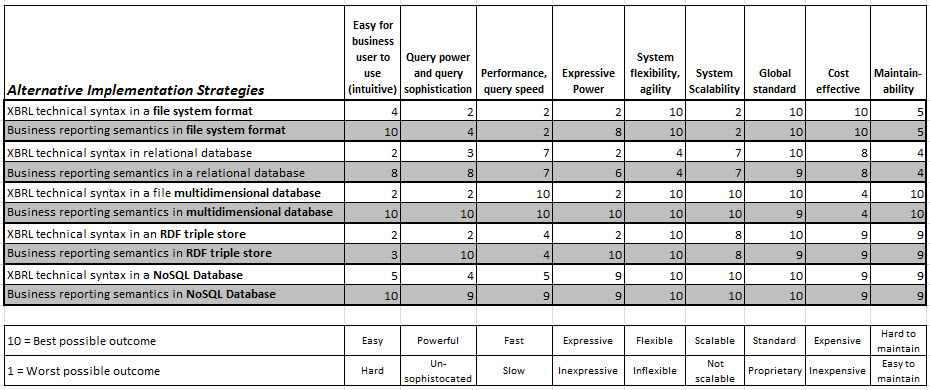
This is the raw data that I used to populate the radar charts:
 (Click image for larger view)
If you don't like the values I assigned for each alternative for each of the constraints, here is the Excel spreadsheet which I used, assign your own values.
You can download the radar graphs and data which are summarized in this PDF.
Reach your own conclusions.
 Charlie
in General Information
|
Charlie
in General Information
|
 Post a Comment
|
Post a Comment
|  Email
|
Email
|  Print
Print
Need for New Global Standard Spreadsheet Alternative
This blog post attempts to synthesize and summarize the blog posts: Understanding Database/Query Options Part 1, Part 2, and Part 3. If you are reading through this and desire additional details, go to those three parts, the details are there somewhere. This information leads me to the belief that a new global standard spreadsheet alternative would be a good thing.
We live in the information age which is a result of the digital revolution. The volume of information is growing at an exponential rate. The majority of that growth is expected to be in the form of structured information. This graph below shows one projection of the growth of structured information:

An increasing number of people are referring to all that data as "Big Data". Sometimes people use the term big data to describe large data sets, other times they use it to describe the exponential growth and quantity of data.
This is my explanation of big data:
BIG DATA is the notion that you no longer have the luxury of treating one database as 'the database' and putting all of the information you have into that one database. Data that you need exists within your organization and external to your organization. The data varies in the representation structure/style (table-type, tree-type, graph-type). It varies by system (Windows, Mac, Linux, etc.). It varies by format: Excel, email, RDBMS, RDF, CSV, etc. The applications used to manage the data vary. Some data is unstructured, an increasing amount is structured. The volume of information is high and it is getting higher. This information is an asset which should not be squandered. The velocity which data grows is increasing rapidly. Some of the information changes rapidly. Some of the data is generated by machines faster than humans can consume it.
The cause of this explosion in information, more and more computers in an ever increasing networked world, is also the solution to the problem. We need the machines to help humans create or use this information asset. Help from machines will reduce costs of using this information asset, reduce the time needed to make use of this asset, and increase the quality of the information asset.
People are generally not really interested in data, per se. They are interested in what you can do with the data. They want to understand data relative to other data, to compare information.
- Data is the most basic level; discrete facts or observations, but unorganized and unprocessed and therefore has no real meaning or value because it has no context; for example, "10,000" is data.
- Information adds context to the data; information is data in context, it has meaning; for example, "Sales for ABC Company for 2012 is $10,000 is information.
- Knowledge adds how to use information to the equation; knowledge is a framework for evaluating and interpreting information which makes use of experience, values, expert insight, intuition with the goal of evaluating and incorporating new experiences and information; for example, the sales for every public company organized in useful ways is knowledge.
- Wisdom adds when to use knowledge; wisdom relates to knowing why and doing something useful; wisdom = knowledge + experience; for example, exercising judgment to sell your shares of some stock because the sales relative to the sales of other public companies and relative to other numbers on a financial statement is wisdom.
To get a machine such as a computer to interact with something in the real world you must express things in a form a computer can understand. Something that is both understandable by humans so that the humans can be sure it is right and understandable by computers enables a computer to help humans perform work. The more a computer understands, the more a computer can do for humans. The more clarity this computer readable information holds, the more successful multiple computers will be in sharing and effectively using the shared information.
These machine readable representations, sometimes called conceptual models or domain models, are more information. The machine readable representation distills down to the important "things" which exist within some business domain and the "relations" between those important things. These machine readable representations of a business domain can be more formal or informal. The representations can have a high level of information about the business domain or a low level of information. The representations can be global standard representations or they can be proprietary representations. Achieving high-semantic clarity or a lower-level of semantic clarity is a choice which is made by a business domain. The choice is based on what the business domain needs the system to do.
These relations between the things of a business domain tend to be highly-structured or semi-structured.
There are three primary formats for representing/modeling these highly-structured and semi-structured information. Each representation approach has pros and cons. Each of these formats has a standard query language:
- Table-type representation - queried using SQL
- Tree-type representation - queried using XQuery or JSONiq
- Graph-type representation - queried using SPARQL
Each of these representation approaches is 100% interchangeable. The key to performace is the indexing scheme, not the information format. Each of these formats has an indexing scheme.
Different database management systems are used to manage these different representation/modeling approaches. Some representation formats fit better into some specific types of database management system. Each database management system likewise has pros and cons for representing information. These pros and cons tend to distill down into the following constraints which must be considered (i.e. other constrains may need to be considered based on some specific situation, but these constraints generally should always be considered):
- Ease of use for business users (as business users manage this information, not IT people)
- Level of query power and sophistication
- Query performance, speed
- Initial system cost and ongoing operating cost
- System management and maintenance cost
- Ability to interoperate with other business systems internal or external to organization
- System flexibility, agility, adaptability by business users, not the IT department
- System scalability
There can be a need to make tradeoffs if a system cannot meet 100% of these constraints. Historically systems seemed to be stratified by the two primary categories: online transaction processing (OLTP) and online analytical processing (OLAP).
Another extremely popular system is the electronic spreadsheet, particularly the very popular Microsoft Excel. But spreadsheets have issues. The disadvantages of spreadsheets are well understood. How to solve the problem of spreadsheets, which has been referred to as "spreadsheet hell", is less well understood.
Now, OLAP systems are increasingly making use of spreadsheets to allow business users to interact with information contained in OLAP systems using spreadsheets or pivot tables. People are building other tools to fight the symptoms which are experienced by the users of spreadsheets.
But none of these approaches is solving the real problem of spreadsheets, they only fight the symptoms which business users and IT departments experience. What if spreadsheets were totally reengineered? What would the requirements be?
Well, here is my summary for the requirements of a better spreadsheet. This new improved version of a spreadsheet is not intended to replace 100% of all existing spreadsheets. Rather, this is intended to be a new alternative, a new category of spreadsheet. An alternative which could be used in 20% of the cases where more control is needed over spreadsheets.
- Readable by both humans and machines: A spreadsheet should be readable by both humans and machines. Information provided within a spreadsheet should be more a representation of information than presentation oriented. The representation can be presented in sheets, rows, columns, and cells but this is done leveraging information metadata and commonly understood patterns. 100% pixel perfect renderings are specifically not a requirement.
- Global standard format: The format of the spreadsheet should be a global standard, not controlled by one software vendor.
- Agreed upon level of semantics: The creators and consumers can agree on the level of semantic clarity they will make use of for a spreadsheet. The spectrum can range from no semantics at all (which is similar to today's spreadsheet) or a high level of semantics expressed by a highly controlled representation model.
- Separation of representation and presentation: The "representation" and the "presentation of the representation" should not be intermingled.
- Business rules separable from spreadsheet: Business rules should be separated from the information when desired, integrated with the spreadsheet when necessary. Business rules which are external to the spreadsheet can be used to "watch over" the things and relations within the spreadsheet. The business rules can be made available publicly via a URL, privately via a private URL, etc.
- Managed global standard: The better spreadsheet should be a global standard under the control of someone like OMG, XBRL International, ISO, Apache OpenOffice, or some other such organization.
- Provide a formal shape but be domain neutral filler: One formal shape should be agreed to, for example the multidimensional model, but the pieces which fit into that shape or "fill" the shape are domain neutral, controlled by the business domain.
- Format should allow for versioning, collaboration, etc: The syntax format should allow for ease of versioning, constructing systems which are collaborative in nature (multi-user).
- Straightforwardly usable over the Internet: The format should be compliant with internet standards.
- Support a wide variety of common business use cases: A wide variety of common business use cases would be served, but it is not a goal to solve every business problem which exists.
- Highly limited options: The number of optional features is to be kept to the absolute minimum, ideally zero. Multiple approaches to solving a problem are not necessary when one will do.
- Formal and concise design: The design must be formal, concise, well designed and well engineered.
The spreadsheet I am describing is somewhat of a "micro system". It allows business users to construct robust systems using what amounts to well engineered Lego-type building blocks created by IT professionals. This avoids or reduces information rekeying. This avoids or reduces the ever expanding "point solutions" which are created using spreadsheets. These micro sytems also will easily integrate into larger business systems.
I cannot really take credit for any of these ideas. I am simply summarizing the ideas of others into one consolidated list. There is a tremendous amount of information here. The best way to get your head around this information is to read this blog post, go read through the details of the other three blog posts mentioned at the beginning, and then read this blog post again.
Is this achievable? Is this even useful? What do you think? Personally, I believe XBRL is already this standard. Go look at SEC XBRL financial filings. Each report component is a spreadsheet.
Charlie
in General Information
|
Post a Comment
| Email
| Print
NOLAP: XBRL-based Global Standard OLAP, No SQL Required
I have abandoned two terms I used to use, XBRLS and "general profile", in favor of a better term created by someone else. That new term is NOLAP.
While traditional OLAP is a powerful and useful tool, OLAP has many known limitations including:
- There is no global standard for OLAP (A company created a product, ADAPT™, which reconciled different OLAP models to one standard model, but ADAPT™ is a proprietary model
- Cube rigidity
- Limited computation support, mainly roll ups; does not support other common types of computation-type relations such as a roll forward (changes between two periods), adjustment (difference between an originally stated and restated amount), variance (difference between two reporting scenarios)
- Limited business rule support and inability to exchange business rules between implementations
- Inability to transfer cubes between systems, each system is a "silo" which cannot communicate with other silos
- Inability to articulate metadata which can be shared between OLAP systems, for example standard dimensions or members used across many systems
- Focus on numeric-type information and inconsistent support for text data types
- OLAP systems tend to be internally focused within an organization and do not work well externally, for example across a supply chain
- OLAP tends to be read only
NOLAP or the "general profile" of XBRL overcomes these issues of OLAP. This is the history of how I have arrived at this point.
Several years ago, in 2008 actually, after having spent a number of years traveling around the world, working on numerous XBRL taxonomy projects and other system implementations of XBRL; Rene van Egmond and I noticed some things about these taxonomies. We wrote a paper which summarized this information: XBRLS: How a simpler XBRL can make a better XBRL. In that paper Rene and I pointed out that:
- (a) XBRL taxonomies were not interoperable,
- (b) there is a need for a "general" implementation profile so anyone could just pick up XBRL and use it and not have to be an engineer/architect to figure out how to put all the pieces together correctly.
It was during that time that Rene helped me understand what semantics was and that semantics and syntax were different things. This helped me understand a bunch of things about the taxonomies I had been creating. At first I thought this was all about "patterns", then I thought that there was a missing logical model, spent time discussing and learning about this "stuff" as part of the XBRL International Taxonomy Architecture Working Group.
All that resulted in a few people actually understanding that XBRL was missing a high-level semantic model and the creation of the XBRL Abstract Model 2.0. It wasn't perfect, but it was a huge step in the correct direction.
I spent the next three years poking and prodding SEC XBRL financial filings in order to understand them and reverse-engineering those filings to try and figure out how to make XBRL work correctly when the extension features of XBRL were used. The goal was to understand how to get the extensibility to work correctly. The reason for that was to both understand how to employ XBRL for financial reporting and to understand how to use XBRL, with extension, in other business domains.
There were numerous discussions that I had with others, pulling together as much useful information that I could. I took all of this information and created what I called a "general profile" for implementing XBRL. That profile took all the best ideas which I had accumulated and pulled them together into one rock-solid architecture and implementation approach.
I took these ideas, tried to get some software vendors to understand them, and even got a handful of software vendors to implement them. One day a software vendor who was not even in the XBRL space contacted me because they thought XBRL offered a solution to a problem that they had.
That collaboration resulted in two different problems being solved: mine and theirs.
I had been experimenting with RDF and OWL to see if they were the approach to solving a big problem that I was experiencing. I eventually distilled the problem into one realization:
The only way a meaningful exchange of information can occur is the prior existence of agreed upon technical syntax, domain semantics, and process/workflow rules.
That statement was then "exploded" into all of the pieces which are necessary to make XBRL work if extensibility is employed: Attaining high semantic clarity and smart digital financial reporting tools.
Basically, none of this is "magic" or "rocket science". It is not subjective in any way, it is objective. It all boils down to attention to detail. Proof of this is looking at SEC XBRL financial filings and understanding why one fails at being able to use the information they contain. You can see what works, you can see what does not work, and most importantly you can see how to fix what does NOT work to make it work. Should one care to look, all this is summarized right here: Summary Information from Evaluating SEC XBRL Financial Filings.
You can also see that right here: SECXBRL.info. If you know what to look for and if you look closely, you can see exactly how to represent financial information digitally and then query that information.
People who take the XBRL technical syntax, take that syntax and put it into a relational database, RDF triple store, or any other database and then try and query the information and try and use it will be disappointed. SECXBRL.info did not make that mistake. SECXBRL.info also improved upon my infosets. My infosets were too rigid. They provided one view of the information, from that of the creator. SECXBRL.info improved upon my infoset format. They even published how they did that, which you can find here.
So ultimately, SECXBRL.info provided two critically important things: (a) financial information represented in a proper semantic format within a database and (b) an easy to use query language to get at that information. You can now look at the information, look at the queries, see what works and what doesn't work and most importantly WHY something does not work. That allows you to fix what is broken to make everything work.
I have always looked at the pieces of an SEC XBRL financial filing as individual "cubes" or "hypercubes". Others do also. If you go to the OLAP Cube page on Wikipedia you see the following as part of a description of an OLAP cube:
A cube can be considered a generalization of a three-dimensional spreadsheet.
One day out of the blue, 28msec started using the term NOLAP to describe those pieces of a financial report. I had used the term "semantic spreadsheet". NOLAP means Not Only SQL based OLAP. I think that is a great term. I am abandoning the terms XBRLS and "general profile" for implementing XBRL. That is what NOLAP is, a general form of implementing XBRL.
NOLAP is a global standard multidimensional model. You can use whatever syntax you want internally in your system, but the model used should be the same across business systems. If you want to exchange information or the model between business systems, XBRL is the syntax for doing that. There is a lot more on that NOLAP Wikipedia page, check it out.
NOLAP brings business analytics to the NoSQL database. Not sure what the current business intelligence vendors think about that.
Good idea? Time will tell. What do you think?
Charlie
in General Information
|
Post a Comment
| Email
| Print
Data Act Passed by Both Senate and House
The Data Transparency Coalition has been working to get The Digital Accountability and Transparency Act, or The DATA Act, passed by congress. They have achieve that goal with both the house and senate passing the bill unanimously. President Obama is highly likely to sign this bill into law.
"Agencies usually do not and cannot tell us how much taxpayer money has been spent on any given program," said Rep. Issa on the House floor shortly before securing the bill's passage. "The American people deserve to know if their taxpayer dollars are being wasted or whether they are being spent wisely."
The next step is implementing this idea correctly, making The Data Act work for the taxpayers. It needs to work significantly better than SEC XBRL financial filings. From what I can tell, this is what it takes to make this digital reporting work correctly. I hope those implementing The Data Act learn from the mistakes of the SEC rather then repeat those same mistakes.
While XBRL is in the running for the global standard format to use, there is competition. The Government Linked Data (GLD) Working Group got started a number of years ago. They have a Data Cube Vocabulary specification. Truth be known, syntax does not matter. Each syntax has its pros and cons. Digital business reporting is coming!
Nice work Data Transparency Coalition!
Charlie
in General Information
|
Post a Comment
| Email
| Print
Understanding SQL-type Queries as Compared to XQuery-type Queries
I have been trying to understand the specific differences between:
- a relational-type query using SQL
- an XQuery-type query
- a SPARQL-type query
Why? Every tool has strengths and weaknesses. It blows my mind how many people love Microsoft Excel but have never even tried Microsoft Access. Excel and Access are two different tools, each has pros and cons. Many Excel users who only know Excel think that Excel is the be-all, end-all solution for everything. It is not. Access is a vastly superior tool for many things, vastly out performing Excel. As is said, "If the only tool you have in your toolbox is a hammer, then everything is a nail."
Information has different forms and databases that store that information likewise can take many forms. Relational databases is one very popular data storage system. SQL is one of the most useful things that I have ever used.
Another useful thing is XML.
XML and relational databases are different. As I understand it there are three primary schemes/models/representations for formatting and processing structured (semi-structured, highly-structured) information:
- Table-type (homogeneous, tabular, consistent): relational databases, CSV, spreadsheets, or tabular-type representations which allow only one level of hierarchy within each table; but hierarchies can be constructed by relating tables
- Tree-type (heterogeneous, arborescent): XML, XBRL (using tuples), JSON and other tree-hierarchy-type information which allow for the expression of one hierarchy
- Open-type or Graph-type (heterogeneous, arborescent): RDF, EAV, XBRL (using dimensions) and other open schema-type or graph-type representations which are more graph-oriented and allow for dynamically creating virtually any number of hierarchies; supports the notion of cycles; very flexible
Now, not surprising, there are three primary query languages which match the type of information representation scheme: SQL, XQuery, and SPARQL.
I don't want to get into SPARQL right now. I want to understand the difference between SQL and XQuery.
I stumbled across this paper: PERFORMANCE ANALYSIS OF XQUERY VS. SQL. The abstract of that paper says the following: (emphasis is mine)
Early in the XML history there were thoughts about whether XML is sufficiently different from other data formats to require a query language of its own, since SQL was already a very well established standard for retrieving information from relational databases.
But there were some differences that justified a new query language for XML data. Relational data is 'flat.' This means it is organized in the form of a two dimensional array of rows and columns. XML data is 'nested' and its depth of nesting can be irregular. On the one hand, relational databases can represent nested data structures by using tables with foreign keys, but it is still difficult to search these structures for objects at an unknown depth of nesting. On the other hand, in XML it is very natural to search for objects with an unknown position in a document. There are other differences, which also convinced the W3C workgroup to design a new XML Query language with a more efficient semantic definition rather than extending a relational language. It would be useful to focus research on programming an Analysis tool between nested databases and relational databases to show performance and scalability with respect to data volume and complexity for both types of queries.
The "Group By" clause in SQL is not easily replaced by features of XQuery. The thesis shows ways to achieve similar functionality and demonstrates that the current XQuery implementations are either non-compliant to the XQuery standard or much slower than SQL when performing "Group By" equivalent requests.
The direct result of this thesis was an Open Source tool, PerfanX, and the performance statistics gathered from a variety of queries run under that tool. The tool uncovered several counter-intuitive performance implications. The study also exposed several bugs in XQuery implementations. The author has reported these to the development groups.
Now, that article was written in 2004 when only XQuery 1.0 existed. Subsequent to this article, grouping was added to XQuery as part of XSLT 2.0. Now we are on XQuery 3.0.
An obvious question might be, "wouldn't it be better if there were ONE query language which supported all three information representation formats?" Well, others had that question. See Translating SPARQL and SQL to XQuery. I don't understand the paper, but I did speak to some people about this and they say that XQuery can represent anything that SQL and SPARQL can represent.
So where am I on this? It seems to me that a relational database can represent anything, but both relational databases and SQL were designed for tabular-type information, rows and columns. Tree-type XML and open-type XML is far richer in its ability to express information because of the ability to express hierarchies. So while it is possible to get SQL to do what XQuery was designed to do, query such hierarchies; the SQL and the databases get increasingly complex as the information becomes richer.
Bottom line: XQuery does a better job querying tree-type information and because of the richness of the information there is a lot more that you can do with the information because of (a) its inherent richness and (b) the features of XQuery to work with hierarchical information. Relational databases and SQL are far more mature than XQuery and have other features which XQuery does not have. The last sentence in that paper mentioned above by the author is this:
XQuery provides a powerful way to query this information and shouldn’t be underestimated.
I don't know that this is an either/or type question. Maybe it is, maybe not. Another outstanding question is performance. I want to personally see the performance.
Another outstanding question is the specific differences between SPARQL and XQuery. Stay tuned!
Charlie
in Digital Financial Reporting, General Information
|
Post a Comment
| Email
| Print

