BLOG: Digital Financial Reporting
This is a blog for information relating to digital financial reporting. This blog is basically my "lab notebook" for experimenting and learning about XBRL-based digital financial reporting. This is my brain storming platform. This is where I think out loud (i.e. publicly) about digital financial reporting. This information is for innovators and early adopters who are ushering in a new era of accounting, reporting, auditing, and analysis in a digital environment.
Much of the information contained in this blog is synthasized, summarized, condensed, better organized and articulated in my book XBRL for Dummies and in the chapters of Intelligent XBRL-based Digital Financial Reporting. If you have any questions, feel free to contact me.
Subjects, Predicates, Objects; Sentences, Statements, Arguments
Going forward, being able to represent logical statements in machine readable form will be important to accountants. Getting the technical people to pick the correct technical tools to represent the knowledge in those statements effectively will also be important. This involves things like the creation of machine readable knowledge graphs. This blog post is a data dumb that I will use to start pulling this information together in your mind.
Subjects, predicates, objects. Sentences, statements, arguments. Where do you start? The first step is to get the jargon correct. This website seems good, Sentence Basics.
There are several areas of knowledge that use the term "sentence" and "statement": linguistics, English, philosophy, computer science, logic. Other similar words are used to describe statements like "claim" and "proposition" and "assertion" and "declaration". Trying to sort this out can be confusing.
When you throw in the notion of "fact" and "opinion" all this becomes even more complicated for people to get their heads around.
Fundamentally, a statement is ONE TYPE of sentence. We are more interested in "statements" than "sentences". Here is why. A sentence is a group of words that usually have a subject, verb (a.k.a. predicate) and information about the subject. A sentence can be a question, a command, or a statement.
An argument is at least two sentences where one of the sentences is a conclusion. For example, "IF it is raining THEN you will get wet."
We are interested in the formal logical technical definition of statement. Here is information from a paper that distinguishes between sentences, statements, and arguments:
A statement is defined as that which is expressible by a sentence and is either true or false.
The criterion of being either true or false is one thing that served to identify the informative use of language. Questions, commands, performatives, and expressions of feeling are neither true nor false.
Statements are logical entities; sentences are grammatical entities.
Not all sentences express statements and some sentences may express more than one statement. A statement is a more abstract entity than even a sentence type. It is not identical with the sentence used to express it.
In this respect, a sentence is like a numeral and a statement is like a number. Each of the following can be used to express the same thing.
In logic, a statement is understood to be "a meaningful declarative sentence that is true or false, or a proposition which is the assertion that is made by (i.e., the meaning of) a true or false declarative sentence.
For our purposes, we need to understand that we are talking about logical statements that is a formal decarative sentence that is either true or false. This is important because once you understand what a logical statement is you can then begin to understand logical connections (logical operators) and logic gates.
Why is this important?
I refer to all this as Computational Professional Services. (There might be a better term, but that is the term I am currently using.
Financial accounting, reporting, auditing, and analysis is transitioning from analog to digital. For that to occur, knowledge in the heads of experts needs to be put into machine readable form by those experts. Machine learning will never create what needs to be created to make this work effectively. Yes, after a solid gounding has been created (training data) then machine learning can supplement that initial knowledge represented by knowledgable experts.
Express knowledge in machine readable form:
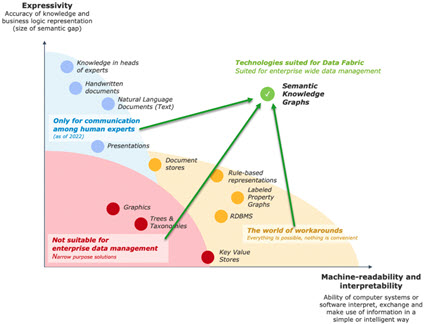
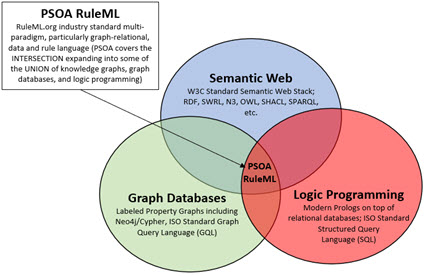
Implementation of knowledge graphs:
Extent to which knowledge can be represented in machine readable form: (sensemaking)
Which path will you take?

Start here! Take charge of your future. There are no short cuts.
 Charlie
in Digital Financial Reporting
|
Charlie
in Digital Financial Reporting
|
 Post a Comment
|
Post a Comment
|
 1 Reference
|
1 Reference
|  Email
|
Email
|  Print
Print
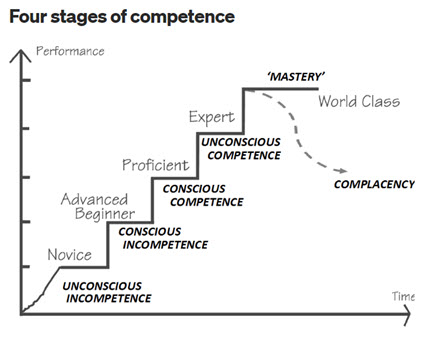
The End (Start Here)
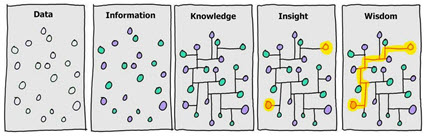
Mastering something is very hard work and you need to make sure you are mastering the right thing. It is an evolution, a progression. This graphic shows that evolution, that progression:
The Great Transmutation of financial accounting, reporting, auditing, and analysis is underway. The Evolution of a System provides a framework for understanding that change and my personal predictions.
If you want to master XBRL-based digital financial reporting, start here. You don't need to read each of the 1,692 posts to my blog. That was just a method for me to organize my brainstorming; my sensemaking activities.
But now my sensemaking activities are over and commercialization activities have begun. Maybe there will be a Universal Digital Financial Reporting Framework. That would be optimal in my view. There are 10 key things that are necessary to create a proper framework:
- Key 1: Rules Served by Immutable Standards based Machine Readable Declarative Rules
- Key 2: Ease of Use is Required
- Key 3: Clear, Understandable Logic
- Key 4: Good Practices and Best Practices
- Key 5: Clear, Understandable Terms, Associations, Rules, Facts
- Key 6: Control of Report Model Modifications to Maintain High Report Quality
- Key 7: Tamper Proof Audit Trail
- Key 8: Standards Convertible into Multiple Technology Stacks
- Key 9: Nothing is a “Black Box”
- Key 10: Standard Logical Conceptualization of a Business Report
A financial reporting scheme represented digitally using an XBRL taxonomy which is then used to represent a report model for a report created by an economic entity in machine readable form serves multiple purposes:
- Description: It is a clear and should be complete description of a report model (specification of what is permitted); created by standards setters or regulators or anyone else specifying a report. And obviously the clear and complete description should represent accounting and reporting rules precisely and accurately.
- Construction: It is a guide to the creation of a report based on that permitted report model description whereby a human can be assisted by software applications utilizing that machine readable description of permitted report models.
- Verification: The actual report constructed can be verified against the clear, complete description assisted by software applications utilizing that machine readable description.
- Extraction: Information can be effectively extracted from machine readable reports and report models assisted by software utilizing that machine readable clear and complete description.
Machine readable knowledge graphs of financial reporting schemes and financial reports are the next step in the evolution of financial reporting.
The Seattle Method is an approach I created to making XBRL-based digital financial reporting work effectively. Auditchain enhances the Seattle Method with the immutable digital distributed ledger "stuff" to take it to the next level, a possible candidate for a Universal Digital Financial Reporting Framework. The business case for a digital version of a general purpose financial report and the case for enhanced transparency are crystal clear. Modern accounting approaches can, and will, ultimately prevail.
Here is a summary of the information that I have to help accountants and software engineers understand XBRL-based digital financial reporting: (You might want to start with this playlist which provides a video overview of digital general purpose financial report)
- Informatics: Informatics for Accountancy
- Use case: Computational Professional Services
- Theory: Logical Theory Describing Financial Report
- Framework: Standard Business Report Model (SBRM)
- Method: Understanding Method (Abridged); Seattle Method
- Principles: XBRL-based Financial Reporting Principles
- XBRL: Essentials of XBRL-based Digital Financial Reporting
- Accounting: Essence of Accounting
- Reporting: Essence of Financial Reporting | Essence of Financial Reporting Metadata
- Financial report: Financial Report Knowledge Graphs
- Record to report: Effective Automation of Record to Report; Business Events
- Expert system: Expert System for Creating Financial Reports Explained in Simple Terms
- Logical Schema: Logical Schema of Financial Reports
- Repository: Good Practices Model for Implementing XBRL-based Reporting System
- Theory-driven Semantic-oriented Financial Report Creation
- Special Purpose Logical Spreadsheet for Accountants
- Case for Sematic Oriented Accounting and Audit Working Papers
Examples Reports:
- Here is the minimal set of examples that you need to study very carfully.
- Here are a bunch of XBRL-based reports that can be helpful in your learning process.
- PROOF representations of US GAAP, IFRS, UK GAAP, and AU GAAP
- Showcase of Capabilities: Hello World!; Hello World using Dimensions; AASB 1060 Report; Billions; Trillions; Lorem Ipsum (Nonfinancial information); MINI Financial Report; PROOF Plus; Dimensions with Many Periods; Comparison of 300 Companies
- Interoperability: Many applications are available.
Golden versions: The very best examples of XBRL taxonomies and reports creatied using the Seattle Method; Standard Business Report Model (SBRM) or Conceptual Model (CM). (SUMMARY)
- Accounting Equation (XBRL Site, SBRM) (Impediments to properly functioning report)
- SFAC6 (XBRL Site, CM)
- SFAC8 (XBRL Site, CM) (Good practices information reposityr prototype)
- Common Elements (XBRL Site, CM)
- Common Elements Version 2 (XBRL Site, CM)
- Common Elements Version 3 (XBRL Site, CM) best version
- MINI (XBRL Site, CM)
- Proof (XBRL Site, CM) (Good practices information repository prototype)
- Essence (XBRL Site, CM)
- MINI with Business Events and Classic Transactions
- XASB (XBRL Site, CM)
- AASB 1060 (XBRL Site, CM)
- Primary Financial Statements for IFRS (Prototype)
These are the verification results from Pacioli verification on IPFS.
Here is a model good practices based XBRL-based reporting system. (Initial draft)
All this builds up to being able to create real financial reports using XBRL. Here is a 10-K financial report created by Microsoft to which I added additional rules: Auditchain Pacioli | XBRL Cloud Evidence Package.
Eventually, all of the above will be summarized, synthasized, organized, and then be available within one resource, Mastering XBRL-based Digital Financial Reporting. That resource will likely be redone by a professional writer eventually. You might want to check this resources page from time-to-time.
Software: Auditchain Suite; Pesseract; Luca (General)
Knowledge Portal Prototype (Here is the vision)
By the way. XBRL is useful for both financial information and nonfinancial information. See Lipsum example.
PLATINUM EXAMPLES: Simpler and improved versions of GOLDEN examples.
Charlie
in Digital Financial Reporting
|
Post a Comment
|
7 References
| Email
| Print
Resources
Financial statements tell a story. It is a milestone in an accountant's career when the accountant can weave together a logical, cogent, true and fair narrative from information provided and tell a story about an economic entity in the form of a financial statement. With the ability to perform that task, an accountant has achieved accounting literacy.
That is precisely what an accountant creating an XBRL-based report must do. But instead of doing this with Microsoft Word, Excel and typing a bunch of stuff into applications that don’t understand accounting; with XBRL-based structured information, accountants need to learn a new approach to telling stories about an economic entity.
Authors Dean Allemang and James Hendler say it well in their book Semantic Web for the Working Ontologist (page 1):
“In the hands of someone with no knowledge, they can produce clumsy, ugly, barely functional output, but in the hands of a skilled craftsmen, they can produce works of utility, beauty, and durability. It is our aim in this book to describe the craft of building Semantic Web systems.”
A brick wall is made of exactly two things: bricks, mortar.
But a brick wall created by a master craftsman, or mason, and a brick wall created by a “weekend warrior” with no knowledge of masonry will be very different. Master craftsmen are created and that process takes time and effort.
The term “mason” can be further broken down in to more detailed distinctions. In the Middle Ages, the terms rough masons, row masons, stone setters, layers and freemasons were used to signify differences in skills. Freemasons who were the most skilled were paid the best .
Masons built our physical world. Knowledge engineers working with subject matter experts will construct our digital world.
Financial reports are rich with associations. Representing that rich set of associations in the form of machine-readable metadata creates the capabilities for software applications that can read and understand those associations to perform what seems like magic.
Information wants to be free from imperfections. Good tools in the hands of master craftsmen using good methods can produce information that is understandable, useful, durable, and perhaps even beautiful and elegant truly sets information free!
Even smart software applications appear “dumb” if they are not provided the right information. “Dumb” includes information that is wrong, contradictory, inconsistent, disconnected, and is not otherwise synchronized. On the other hand; properly organizing information enables sophisticated software applications to perform to their potential.
This information is provided in the form of machine-readable models and other metadata that help accountants perform their work effectively. How exactly to create those associations and what the associations might look like are up to debate. Regardless of how that debate might turn out; associations are important.
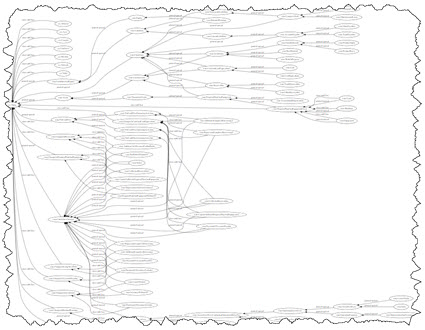
Below is a set of associations from a rather small financial reporting scheme:
David Weinberger points out in his book Everything Is Miscellaneous two very important things:
- That every classification scheme ever devised inherently reflects the biases of those that constructed the classification system.
- The role metadata plays in allowing you to create your own custom classification system so you can have the view of something that you want.
Mr. Weinberger continues in his book by pointing out the notion of the three orders of order:
- First order of order. Putting books on shelves is an example the first order of order.
- Second order of order. Creating a list of books on the shelves you have is an example of second order of order. This can be done on paper or it can be done in a database.
- Third order of order. Adding even more information to information is an example of third order of order. Using the book example, classifying books by genre, best sellers, featured books, bargain books, books which one of your friends has read; basically, there are countless ways to organize something.
Associations and classification are two very important tools of the information age. Those that understand how to use tools and techniques and create this metadata, those who are craftsmen and perhaps the information age equivalent to a freemason will construct our digital world.
* * *
My blog archive has 1,692 posts. My suggestion is that you start here if you are working to understand. I have tried to summarize everything important from this blog into the document(s) Mastering XBRL-based Digital Financial Reporting. Eventually, everything will end up there. The following are additional helpful resources that have not yet been incorporated into those documents:
- Open University
- Private Equity
- Fluree Web3 Data Platform
- TerminusDB
- AnzoGraph Database
- Data Fabric
- Jupyter
- Logic
- Accounting is being outpased by financial innovation
- Accounting has been outpaced by financial innovation, LibraTax
- Accountants and auditors are financial doctors. We have just given them penicillin.
- The Future of Accounting (demand, Marysville University)
- The Future of Accounting (predictions, Marysville University)
- Accounting Using Tokens (Video)
- Understtanding Financial Statements (Slides)
- History of Accounting (Video)
- Triple-entry accounting (bookkeeping)
- Triple entry accounting (video)
- Blockchain (the book)
- Token Economics Video Playlist
- Web3
- Excellent Explanation of Bitcoin (Video)
- Decentraizing the Semantic Web: Who will Pay to Realize it?
- Harvard Business Review: What is Web3?
- "In theory, a blockchain-based web could shatter the monopolies on who controls information, who makes money, and even how networks and corporations work."
- "This is the vision of the read/write/own web [Web3]."
- "NFTs can operate on a smaller scale than coins because they create their own ecosystems and require nothing more than a community of people who find value in the project. For example, baseball cards are valuable only to certain collectors, but that group really believes in their value."
- "We’ve heard all this before, and we’ve seen how earlier episodes of Web3 euphoria fizzled. But that doesn’t mean it should be written off entirely. Maybe it booms, maybe it busts, but we’ll be living with some form of it either way. What version — and how your company responds — could determine the future of the digital economy and what life online looks like for the next internet epoch. For now, that future is still up for grabs."
- Artificial Intelligence
- Measuring Metadata Quality
- Architecture
- Papers
- ACFR Taxonomy (State and Local Governement Financial Reporting)
- Australian Accounting Standards
- Key Auditing Matters (KAMs)
- Symposium
- Audit framework for financial institutions
Charlie
in General Information
|
Post a Comment
| Email
| Print
Effective Automated Information Exchange and Explainable AI (XAI)
IF we humans want machines to help us humans in our information exchange efforts; THEN we humans need to deliver meaningful, purposeful, actionable information to the point of need, at the right time, in an accessible, reusable format, and the entire process needs to be 100% controllable and understandable to the human system operators.
Whether the information exchange is one human exchanging information with another using a software application or one software application API exchanging information with another API; the above paragraph is true.
Fundamentally, accounting is an information exchange technology, in fact accounting was the world's first communications technology. Accounting has evolved before, it is evolving again; going through a great upheaval like many, most, others.
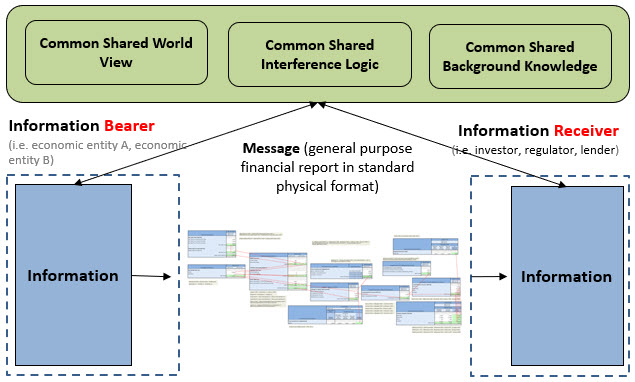
Note that we are talking about the exchange of information, not the exchange of data. Exchanging information is about the receiver being able to take action with that information. The receiver wants to increase knowledge, insight, and wisdom.
Explainable artificial intelligence (XAI) helps humans automate tasks and processes. Pacioli is explainable artificial intelligence. You need Pacioli or something like Pacioli to make XBRL-based digital financial reporting to work.
The use case of financial reporting is such that the creators of reports are permitted to modify the report model of the information being exchanged within specific permitted boundaries. Software must be able to handle this business use case effectively, enabling business professionals to control the process and staying within those permitted boundaries. Software needs to provide 'bumpers" as some people call it or "guard-rails" as it is called by others.
Auditchain's Pacioli does the above effectively. This fact is provable and can be demonstrated. Pacioli is the result of 20 years of effort.
I don't know exactly what to call Pacioli. At first I called Pacioli a logic/rules/reasoning engine. Then I referred to it as a knowledge engine. Now I am contemplating that Pacioli is an insights engine. For now, I consider Pacioli a logic/reasoning/rules/knowledge/insights engine in order to be complete I guess.
The rules and information Pacioli works with is declarative, global standard XBRL. Article 4 of the Business Rules Manifesto states that rules should be declarative rather than procedural. Declarative is more flexible, reusable, and easier to maintain.
Merkle trees and Merkle proofs can be leveraged to make sure the declarative rules have not been tampered with and provide an audit trail. IPFS provides reliability. Pacioli leverages both Merkle trees and IPFS.
XBRL processors + XBRL formula processors are defecient when it comes to processing XBRL-based financial reports. Pacioli leverages the open source Arelle XBRL processor and XBRL formula processor; enhancing those capabilities and filling in the gaps between what is provided and what is needed for effective XBRL-based financial reporting.
The Standard Business Report Model (SBRM) of OMG provides a standard logical conceptualization of a business report. A general purpose financial report is a specialization of a business report (a type of business report). The Logical Theory Describing Financial Report specifically defines the logic of financial reports and is the basis for SBRM. SBRM enables the creation of a digital alternative to the general purpose financial report which has been, historically, analog. The Seattle Method, which is supported by Pacioli, implements the Standard Business Report Model.
But Pacioli, SBRM, XBRL, and the Seattle Method are not an end game; they are a beginning. The starter set of rules provided for Pacioli are likewise only a beginning. The XBRL-based global standard rule framework is an approach to implementing customizable but controllable financial reporting schemes. The same approach can most likely also be used for general business reporting use cases.
There are two approaches to artificial intelligence and, as I have said before, the right approach should be used for the given job. The two approaches are:
- Rules-based systems (expert systems, three basic types)
-
Classification or diagnosis type: helps users of the system select from a set of given alternatives.
-
Construction type: helps users of the system assemble something from given primitive components.
- Simulation type: helps users of the system understand how some model reacts to certain inputs.
-
- Patterns-based systems (machine learning which can be supervised or unsupervised, five basic type, this video explains the types)
- Clustering algorithms: categorize or group things
- Explanatory algorithms: explain the relationships between variables
- Ensemble learning algorithms: use multiple models
- Similarity algorithms: compute the similarity of pairs of things
- Dimensionality reduction algorithms: reduces variables in a dataset
Currently, Pacioli has no machine learning capabilities. I am no machine learning expert by any measure, but I suspect machine learning is coming at some point. I do know that to make machine learning work you need training data and that the machine learning is only as good as its training data.
Who will put all these pieces together effectively? Who will be first? The answer to that question will revel itself over time.
My personal focus is getting a rules-based expert system built, see here, Expert System for Creating Financial Reports and Logical Schema of Financial Reports. I know of at least 8 other individuals and groups that have an interest in this at different levels. Some are focuses at the traction or business event level; others are focused on the complete record-to-report process. Others are focused on providing an environment within which all this will operating including Auditchain and Twali.
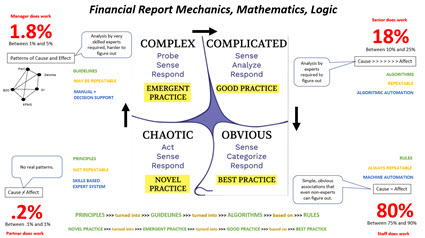
Which path will you choose? Simple but wrong; or Complex but right?
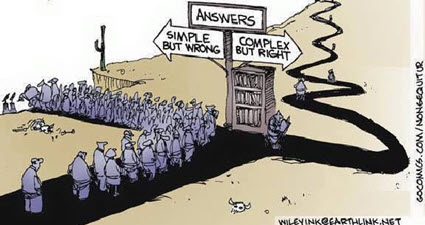
Does all this seem like a mystery to you? Well, it really is not that mysterious at all if one has been paying attention and has tried to make sense of all this (i.e. employ sensemaking). I think the risk equation has flipped; it is more risky NOT to be paying attention to all this that it was to get in early and go down the wrong path.
###########################
Charlie
in Digital Financial Reporting
|
Post a Comment
|
4 References
| Email
| Print
Cryptocurrency Trading Pairs
This article, What are Trading Pairs in Cryptocurrency?, discusses cryptocurrency trading pairs. USDT-AUDT is a trading pair.
#########################################################
Bridge from Ethereum to Polygon
Charlie
in Cryptocurrency
|
Post a Comment
|
2 References
| Email
| Print
