BLOG: Digital Financial Reporting
This is a blog for information relating to digital financial reporting. This blog is basically my "lab notebook" for experimenting and learning about XBRL-based digital financial reporting. This is my brain storming platform. This is where I think out loud (i.e. publicly) about digital financial reporting. This information is for innovators and early adopters who are ushering in a new era of accounting, reporting, auditing, and analysis in a digital environment.
Much of the information contained in this blog is synthasized, summarized, condensed, better organized and articulated in my book XBRL for Dummies and in the chapters of Intelligent XBRL-based Digital Financial Reporting. If you have any questions, feel free to contact me.
Entries from March 1, 2021 - March 31, 2021
The Graph, The GRT Token, and Digital Economics
The Graph appears to be an API for querying information in a blockchain. The Graph provides an Explorer. This YouTube Video, Query Ethereum with GQL with The Graph, provides a really good explanation.
The GIF animation is helpful in understanding what you can do with The Graph. Think of a new digital infrastructure for performing work. As this YouTube Video explains you have the following roles:
- Indexers
- Consumers
- Curators
- Delegators
- Fisherman
- Arbitrators
GRT tokens are exchanged by those filling the different roles. For examples, CPAs and CFAs providing machine-readable rules (Curators) that can be used by data aggregators (Consumers) to use XBRL-based financial information from the SEC, ESMA, or other financial information repository. This animated GIF helps to explain:
Interesting stuff! Digital infrastructure is necessary to operate the digital economy.
############################
Understanding the Role of XBRL (Brainstorming)
There is more and more really good information coming out about knowledge graphs, artificial intelligence, distributed ledgers, and all the "stuff" that enables the creation of things like a Universal Digital Financial Reporting Framework.
This PowerPoint, Understanding the Role of XBRL, is my brainstorming related to explaining the role XBRL plays in all this. Fundamentally, XBRL is (can be when used correctly) a super-safe and very powerful and appropriately flexible knowledge graph which can be used to represent a general purpose financial report in both human-readable form and machine-readable form. This graphic from Deloitte Germany (which I modified slightly) helps you understand:
XBRL is used to represent the "stuff" in the center. Flip through the slides for a better explanation. A video is on the way. Working through the current tangle of terminology can set you on the right path. Search my blog for more information about knowledge graphs.
Think supercharged AI.
Accounting Evolved from Physical Objects to Digital
Paper has had a good run, some 1,900 years. Paper was invented in China around 100 AD. The rudimentary technology was constantly improved over its life span. But that long life span has created a "paper mentality" that accountants need to set aside. We need to escape from the imaginary boundaries created by 1,900 years of working with paper. We need to create new habits.
But paper was not the first media for representing financial information. Accounting has changed before and accounting, and will, surly change again. Accounting existed in well before writing, having been invented somewhere between 5,000 and 10,000 years ago. Before writing was invented, accounting was performed using physical objects (tokens).
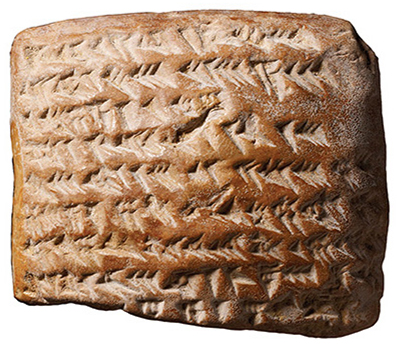
Writing was first developed around 3200 B.C. by Sumerian scribes in the ancient city-state of Uruk, in present-day Iraq, as a means of recording accounting transactions. The form of writing was called cuneiform. Cuneiform writing was created by using a reed stylus to make wedge-shaped indentations in clay tablets. Stone was also used if you wanted a more permanent record I guess.
Clay tablets did not last long as an accounting media. Clay was bulky, heavy, and had a tendency to break. Papyrus was used as a writing material as early as 3,000 B.C. in ancient Egypt. Papyrus was produced exclusively in Egypt where the papyrus plant grew; but papyrus was exported throughout the classical world, and was the most popular writing material for the ancient Greeks and Romans.
Papyrus continued to be used for commercial purposes to some extent until around 1100 A.D. It continues to be used today by artisans.
Paper was used as the primary media of accounting, reporting, auditing, and analysis until about 1970 or 1980 A.D. Getting a copy of a financial statement in the 1930s, 1940s, and 1950s involved physical technologies such as carbon paper (remember that!).
In those early days, public company financial reports submitted to the U.S. Securities and Exchange Commission were submitted on paper and were available only by paper copy. In the 1970's, the SEC contracted with a company to create and distribute microfiche copies to designated SEC "public reference rooms" in specific locations in the US. (They seemed to have these rooms in Chicago and New York.)
Obtaining copies of these documents was cumbersome and expensive. An individual had to either make hard copies one page at a time in the public reference rooms or order copies from service bureaus whom in turn had to make and sell hard copies as requested.
Immediate access to reported financial information was virtually impossible except at extremely high cost.
In 1984 (before the internet even existed), the SEC started the EDGAR (Electronic Data Gathering Analysis and Retrieval) pilot program. The purpose of the pilot was to create an electronically accessible database providing a more efficient and less costly method whereby the investing public could get the information it needed. (Lessons learned from the SEC EDGAR pilot project.)
Since 1996, all reporting companies have been required to file electronically. This new method of filing has enormous implications for the investment community because once a document is filed, the information is immediately available to anyone.
In 2008, the SEC Chairman Christopher Cox unveiled the successor to the agency’s 1980s-era EDGAR database. The new system, IDEA (Interactive Data Electronic Applications) was based on a completely new architecture being built from the ground up. The idea behind IDEA was for the SEC to transition from collecting "forms" and "documents" to collecting information. That information would be freely available to investors and analysts. EDGAR was moving from "electronic" to "digital".
The U.S. SEC was not the first to transition to digital and it will not be the last either. Today there are 180 projects around the world in 60 different companies.
Today, there is an opportunity to create a Universal Digital Financial Reporting Framework. Not only will the report itself be digital, the infrastructure of financial accounting, reporting, auditing, and analysis will also transition to digital. Accounting will become more modern.
The general purpose financial report itself and the media used to represent that general purpose financial report are two different things.
How absurd is it to put accounting information (transactions) into a database, print a report from that database, send that report to someone else, and then they rekey the information back into another database that is used for financial analysis? We have the technology to improve this process.
Accountants need to adapt to changes created by the Fourth Industrial Revolution. Not adapting has consequences.
Configure Models, Skip Coding
These guys have it right. Configure models, skip coding. Here is a list of advantages. Here is another company that seems to get it.
Data Fabric
Learned something new: Data fabric. Comes from this article, Data Fabrics: The Killer Use Case for Knowledge Graphs. That article defines data fabric as:
"A Data Fabric is (a data management architecture that) orchestrates disparate data sources intelligently and securely in a self-service and automated manner, leveraging data platforms such as data lakes, Hadoop, Spark, in-memory, data warehouse, and NoSQL to deliver a unified, trusted, and comprehensive real-time view of customer and business data across the enterprise."
Seems like that might work for financial accounting, reporting, and audit information also although that might already be included in the "business data".
So, why limit this to "the enterprise". The definitions the article has for knowledge graph does the same thing. Why can't a data fabric be for an entire supply chain???
For example, it seems that all the XBRL-based reports plus their supporting XBRL taxonomies (models) submitted to the U.S. Securities and Exchange Commission constitute a data fabric.
Personally, seems like this should be called an "information fabric" or a "knowledge fabric".


