BLOG: Digital Financial Reporting
This is a blog for information relating to digital financial reporting. This blog is basically my "lab notebook" for experimenting and learning about XBRL-based digital financial reporting. This is my brain storming platform. This is where I think out loud (i.e. publicly) about digital financial reporting. This information is for innovators and early adopters who are ushering in a new era of accounting, reporting, auditing, and analysis in a digital environment.
Much of the information contained in this blog is synthasized, summarized, condensed, better organized and articulated in my book XBRL for Dummies and in the chapters of Intelligent XBRL-based Digital Financial Reporting. If you have any questions, feel free to contact me.
Entries from July 29, 2018 - August 4, 2018
Comprehensive Analysis of IFRS-BSC-ISFUNC6-SCI1-CF1 Reporting Style
I am going to do a comprehensive analysis of each of the IFRS reporting styles that are used by the 406 listed companies that submit reports to the SEC. The analysis will use POSITIVE and NEGATIVE evidence to support each reporting style. The evidence includes a working validator that exercises the rules of the reporting style using an Excel spreadsheet that I created. I provide two spreadsheets: one for companies that pass 100% of tests and one that fails one or more tests. I also provide additional documentation. You can get the analysis of IFRS-BSC-ISFUNC6-SCI1-CF1 here in this ZIP file.
The bottom line is the following for this most popular reporting style:
- 98% of the information in the 92 XBRL-based reports is consistent with my machine-readable validation rules.
- 62% of filings are consistent with 100% of my machine-readable rules.
- I have provided high-quality documentation for 23 confirmed filer errors that is an excellent learning tool. (That is the same document that is in the ZIP file.)
- The documenation both explains the filer error and provides links to the actual SEC filing page of the report and to the XBRL Cloud Viewer that enables you to look at XBRL taxonomy information related to the filer error.
If you are not clear on what a reporting style is, I would encourage you to have a look at this documentation which explains each of those funny looking codes that make up a reporting style.
Below is a summary of the reporting styles of all 406 IFRS reports in the set of companies that I am analyzing. I am choose not to analyze all of these reporting styles, but I certainly will analyze the most popular reporting styles.
If you still don't grasp why I am going through all this trouble, you might want to read (or re-read) the Computer Empathy document. Trust me when I say that there is a method to my madness.
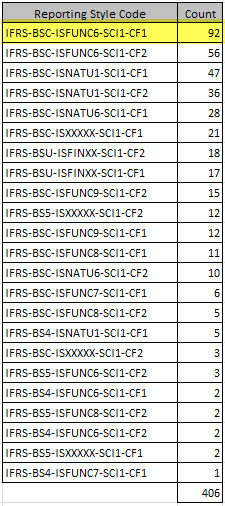 (Click image for detailed information about each reporting style)
 Charlie
in Becoming an XBRL Master Craftsman
|
Charlie
in Becoming an XBRL Master Craftsman
|
 Post a Comment
|
Post a Comment
|  Email
|
Email
|  Print
Print
Understanding Blocks; Microsoft Example
Many people try and use information from a financial report at the level of the individual facts in the report. That is one way. But there is another way. That other way is working with sets of facts. For example, the "balance sheet" is a set of facts, the "income statement" is a set of facts, the "maturities of long-term debt" disclosure is a set of facts.
But how do you identify those sets of facts? That is what I will explain.
So, I will be using this Microsoft 10-K filing to explain. You can go there and get the XBRL instance, use the HTML version of the 10-K. Or, you can look at that same report using the XBRL Cloud Viewer to view the Microsoft filing here.
To start, have a look at this Excel spreadsheet (within a ZIP archive). That spreadsheet contains information on the Network, the Components, and what I call Blocks contained within that Microsoft 10-K.
There are 127 Networks. Now, Networks is generally not to right level to be looking at sets of information within a report. Why? Because companies represent information differently. For example, companies could put two Tables (or Hypercubes) within one Network; so just looking at the Network would give you different results. So, what about Tables (or Hypercubes)?
There are 127 Tables in the Microsoft 10-K. Why the same as Networks? Because Microsoft used a Table (Hypercube) to represent the information in each Network. So for Microsoft there are the same number of Networks and Tables, there is a one-to-one correlation. But, this is not true for every XBRL-based reports. Sometimes companies put TWO Tables within a Network. I call the Network + Table combination a Component. Those are on the second tab in that Excel spreadsheet.
There is another layer which I call the Block. There are 191 Blocks in that Microsoft 10-K. A Block goes one layer deeper. It breaks Tables down into individual "roll ups" and "roll forwards" and other sets of information. Now, these sets are 100% consistent across all XBRL-based reports created by any company. Why? Because the set is determined by logic, not by the preferences of how information is presented in a report.
What I mean is this. The "Inventory, Net, Components Roll Up" of a report will ALWAYS be one set of information. That set will be a roll up. This is by definition. That roll up always has a total concept, every roll up does, again by definition of what a roll up is. That total concept is "us-gaap:InventoryNet". That Level 4 Disclosure roll up detail is always represented one of two Level 3 Disclosure Text Blocks. There are other rules. Here is a human readable version of those rules. Here is that same information in machine-readable form (it was actually used to generate the human readable version of those rules).
That information can be used to identify what information is being represented by a Block of information in an XBRL-based report. That information can also be used to identify where that information is in the report no matter what Network or what Table.
Here are the 191 Blocks represented in the Microsoft 10-K in machine readable form: Model Structure | Fact Tables.
Here is information for about 70 of those 191 blocks in human readable form. Why do I only have human readable information for 70 of the 191 Blocks? Because I only have machine-readable rules for 70 disclosures. Here is the evidence package for Microsoft.
Pretty nifty! (If you don't understand why this is nifty, read Computer Empathy.) If you want to understand more, read Putting the Expertise into an XBRL-based Knowlege Based System for Creating Financial Reports.
Charlie
in Becoming an XBRL Master Craftsman
|
Post a Comment
| Email
| Print

