BLOG: Digital Financial Reporting
This is a blog for information relating to digital financial reporting. This blog is basically my "lab notebook" for experimenting and learning about XBRL-based digital financial reporting. This is my brain storming platform. This is where I think out loud (i.e. publicly) about digital financial reporting. This information is for innovators and early adopters who are ushering in a new era of accounting, reporting, auditing, and analysis in a digital environment.
Much of the information contained in this blog is synthasized, summarized, condensed, better organized and articulated in my book XBRL for Dummies and in the chapters of Intelligent XBRL-based Digital Financial Reporting. If you have any questions, feel free to contact me.
Entries from February 10, 2019 - February 16, 2019
Things, Not Strings; Understanding Knowledge Graphs
Jo Stichbury, in his article WTF is a knowledge graph, does a great job of explaining what a knowledge graph is and why it is useful. Here are the key points as I see them related to knowledge graphs:
- A knowledge graph is a graph rather than a table, or a tree. I pointed out the difference between tables, trees, and graphs in the document Computer Empathy (page 16). Basically, a graph is a powerful and flexible way to store knowledge.
- A knowledge graph is self-describing; basically there is logic that explains the meaning being conveyed within the knowledge graph.
- It is not simply about the knowledge graph itself but more about the combination of the knowledge graph and tools to work with the information within the knowledge graph. The object is to make use of the information in the knowledge graph.
If you want to understand more about knowledge graphs, see this paper Towards a Definition of Knowledge Graphs.
So why are knowledge graphs plus the tools for using information from a knowledge graph so important? Using the right tools, a skilled craftsmen can easily produce works that are useful, elegant, and durable.
Today, many software developers and business professionals are using the wrong tools. They tend to be stuck in the "data" world when we have really moved on to the "information" age. Most business professionals have clumsy, ugly, barely functional software that does not remotely meet their needs when it comes to working with structured information such as XBRL.
There are many modern tools for building useful, elegant, and durable tools. For example, GRAKN.AI is an open source tool for building knowledge graphs and using information. It is basically infrastructure. It is only the foundation upon which products or solutions would be constructed.
Why is understanding knowledge graphs important to business professionals? Because it helps them understand what to ask for in terms of tools.
Consider this definition of a knowledge based system which I have provided before:
A knowledge based system is a system that draws upon the knowledge of human experts that has been represented in machine-readable form and stored in a fact database and knowledge base. The system applies problem solving logic using a problem solving method to solve problems that normally would require human effort and thought to solve. The knowledge based system supplies an explanation and justification mechanism to support conclusions reached by the knowledge base system and presents that information to the user of the system.
A modern application for creating a financial report will be a knowledge based system which leverages technologies such as knowledge graphs to make them work elegantly and effectively.
 Charlie
in Becoming an XBRL Master Craftsman
|
Charlie
in Becoming an XBRL Master Craftsman
|
 Post a Comment
|
Post a Comment
|  Email
|
Email
|  Print
Print
Logical Theory Describing a Business Report
A logical theory defines and describes things. Details must be explained to brainless robots. Once you define things you can ask questions. Interestingly, the discipline of describing something in a form a computer algorithm can understand assists you in understanding the world better, weeding out myths and misconceptions.
Several years ago Rene van Egmond and I wrote a logical theory which describes a financial report, Financial Report Semantics and Dynamics Theory.
We used that base, removed everything related to the domain of financial reporting (which is a specialization of a business report), and now we have a Logical Theory Describing a Business Report (the more general use case).
There really are very few differences. One difference is that a financial report has "disclosures". The equivalent in a business report is a "fact set".
A logical theory is an excellent communications tool. In order to get a software engineer or a team of software engineers to be able to work together and build the right software, a logical theory is very helpful.
If anyone has any feedback, please send it. Always looking for ways to improve!
Charlie
in Becoming an XBRL Master Craftsman
|
Post a Comment
| Email
| Print
Case for XBRL-based General Purpose Financial Reporting on One Slide
Financial reporting has a direct link to the well being of society. The world needs a digital alternative to the paper-based or "e-paper" general purpose financial report. The following is a summary for the case for XBRL-based general purpose financial reporting summarized on one slide:
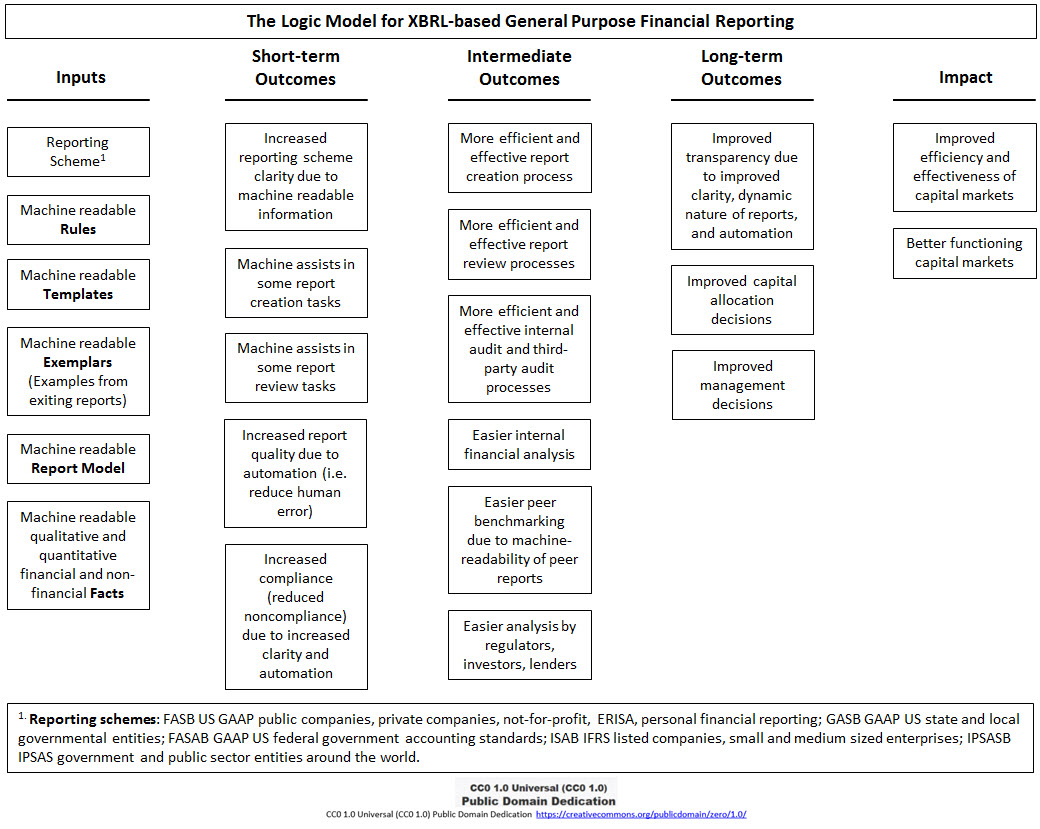
(Click image for a larger view)
A general purpose financial report is a high-fidelity, high-resolution, high-quality information exchange mechanism. That mechanism has historically used the media of "paper". Over the past 50 years or so, that paper-based mechanism has given way to a new mechanism, "e-paper". By "e-paper" I mean PDF documents, HTML documents, Word documents and such.
XBRL is a new media, a new mechanism for creating a general purpose financial report. XBRL is a high-fidelity, high-resolution information exchange media that allows for the creation of high-quality financial reports. Those reports can be read by human-based processes as before but because of their structured nature are also effectively readable by machine-based processes.
And oh, XBRL is great for special purpose financial reports also.
If you don't understand how this would work, read Computer Empathy and maybe Financial Tansformation and the Modern Finance Platform. If you want to understand how to implement this, read Method of Implementing a Standard Digital Financial Report Using the XBRL Syntax and this step-by-step example of that method.
Here is a graphic that shows more details about the tasks involved in creating a financial report:
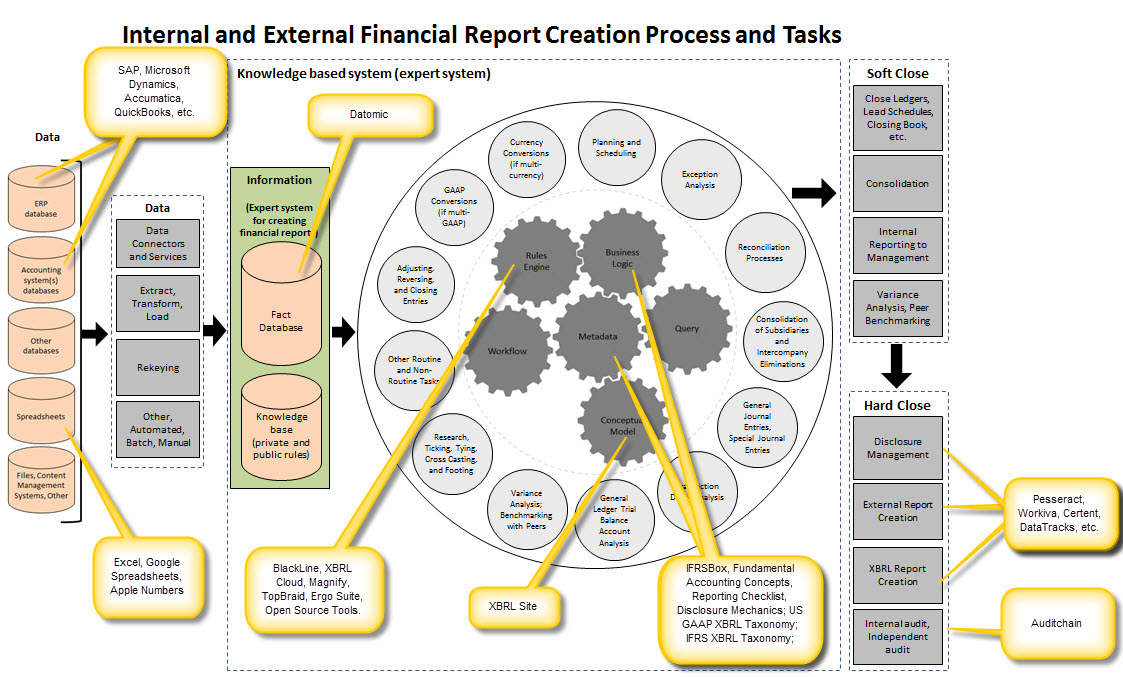
(Click image for larger view)
Charlie
in Digital Financial Reporting
|
Post a Comment
|
 10 References
| Email
| Print
10 References
| Email
| Print

