BLOG: Digital Financial Reporting
This is a blog for information relating to digital financial reporting. This blog is basically my "lab notebook" for experimenting and learning about XBRL-based digital financial reporting. This is my brain storming platform. This is where I think out loud (i.e. publicly) about digital financial reporting. This information is for innovators and early adopters who are ushering in a new era of accounting, reporting, auditing, and analysis in a digital environment.
Much of the information contained in this blog is synthasized, summarized, condensed, better organized and articulated in my book XBRL for Dummies and in the chapters of Intelligent XBRL-based Digital Financial Reporting. If you have any questions, feel free to contact me.
Entries from April 7, 2019 - April 13, 2019
AccountingToday: Automation: Don't panic!
Yair Holtzman, in his AccountingToday article Automation: Don't panic!, does one of the best jobs of explaining what is in store for professional accountants over the next five years that I have run across. Mr. Holtzman correctly points out that the next five years is an opportunity:
But don’t panic — while a significant number of accounting positions may be lost as machines perform redundant, repeatable and time-consuming tasks, many employers also stand to benefit from the transition. Accounting firms will need to shift manpower to focus on developing more strategic, consultative and value-additive initiatives within their niche practices.
He goes on to point out:
Rapid technological advances have led to innovation in the accounting profession at a pace that will likely accelerate over the next five years. Today’s midsized accounting firms will need to navigate around numerous technological advances as the digital economy continues to evolve. This metamorphosis will likely require a shift to higher-end, value-added services, a working knowledge of cutting-edge technologies such as AI and blockchain and the ability to employ big data analytics in optimizing strategic business decision-making.
Yair is not alone in his beliefs. Deloitte's vision of The Finance Factory, Blackline's vision of financial transformation and the modern finance platform, my view of the utility of an XBRL-based general purpose financial report, and other visions of what the future might hold are pointing to rapid change enabled by technology.
It is not like change has never happened before within the institution of accounting. As I pointed out in Introduction to the Fact Ledger, double-entry accounting was first used in 1211 AD. But double-entry accounting did not come of age until between 1299 AD and 1300 AD. And it was not until 1494 AD that double-entry accounting was documented and proliferated. Change take time. Many things take less time because of the communications enabled by the Internet.
An example of the sorts of things that will change can be understood by looking at the working proof of concepts that are being created for evaluating XBRL-based financial reports. This evaluation report combines the capabilities of a number of separate tools into one set of capabilities. So say, if you combined what XBRL Cloud was doing, what XBRLogic was doing, and what I am doing; you can see the hand writing on the wall rather clearly.
The next five years will be interesting. Want to be ready? Consider reading Computer Empathy.
##############################
 Charlie
in Digital Financial Reporting
|
Charlie
in Digital Financial Reporting
|
 Post a Comment
|
Post a Comment
|  Email
|
Email
|  Print
Print
Technique for Verifying that Fundamental Accounting Relations are Intact
I have developed a technique that uses standard, off-the-shelf software or existing open-source software to make certain that the high-level fundamental accounting concept relations are (a) intact and consistent and (b) assure that a user of the report can reliably extract information from an XBRL-based financial report.
Further, if the SEC enforced its own rules that require XBRL calculations to be provided, then the entire balance sheet, income statement, cash flow statement, statement of changes in equity; and any disclosure that ties to those statements would also be verified to be correct (roll ups). This would still leave roll forwards and dimensional roll ups not being computed however because.
But, if software vendors and filing agents helping public companies create XBRL-based reports would use XBRL Formula during the creation process to verify all mathematical relations, then 100% of all facts that are on the primary financial statements or tie to the primary financial statements would be verified to be mathematically consistent with what one would expect.
Let me say this again. If the technique described in the first paragraph were used, then all of the fundamental accounting concept relations continuity cross checks would be passed by every software vendor and filing agent. What that would mean is that the validation results would look like this:
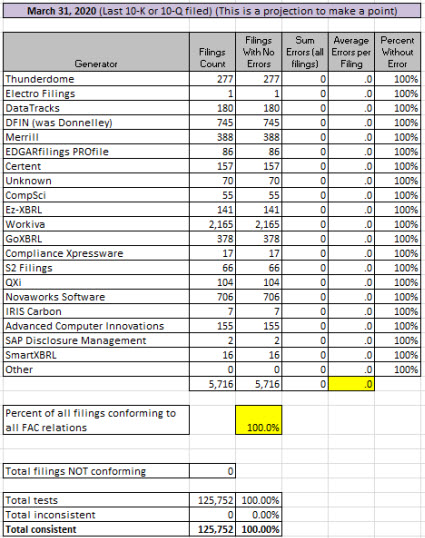
Note that there are ZERO inconsistencies with the high-level fundamental accounting concept continuity cross checks.
So, how does my technique work? It works like this: Each public company declares and/or configures their "reporting style" or their fundamental accounting concept relations when they create their report using machine-readable rules. The SEC could build upon this by (a) requiring reporting entities to include this declaration/configuration in their report and (b) providing validation that MUST be passed for a report to be accepted as filed with the SEC.
The process works like this:
- Define concepts: Each fundamental accounting concept is represented in machine-readable XBRL form, like this.
- Define impute rules: Each "impute rule" that is used to derive unreported facts is created in machine-readable XBRL form, using XBRL Formula. Here are two impute rules for deriving commonly unreported subtotals: Noncurrent Assets | Liabilities. (Ugly and hard for humans to read, yes I know; but (a) experts would create these rules that average accountants would use and (b) the users would interact with natural language representations of the rules such as "Assets = Current Assets + Noncurrent Assets" and "Liabilities = LiabilitiesAndEquity - Equity".) (Here are the 105 impute rules that I use)
- Define consistency rules: Each "consistency rule" would be defined in machine-readable XBRL form, using XBRL Formula. You would create sets of these rules for each statement format. Here are two examples: Classified Balance Sheet | Order of Liquidity Balance Sheet (Unclassified) (Here are the 49 consistency rules I use)
- Declare/Configure: Those creating reports would select (a) the consistency cross checks rules that described their reporting style and (b) any impute rules that are necessary for a machine to understand their high-level reported information. They would include the rule sets in their XBRL instance by referencing the rules. The rules could be included during the report creation process to test the consistency of the report to the consistency rules. The rules could be REMOVED from the XBRL instance prior to submitting to the SEC until such a time, if ever, that the SEC allows the rules declaring/configuring the fundamental organization of the report are allowed to be submitted.
- Result: The result would be (a) machine-readable rules that explicitly explain/declare the configuration of the report and (b) machine-based processes for verifying the consistency of the report to the declared configuration using existing off-the-shelf or open source XBRL processors and/or XBRL Formula processors.
This ZIP file contains a working proof of concept. This was run using the UBmatrix XBRL Processor and XBRL Formula Processor. This is the command line BATCH file that I used. I am going to test this same working proof of concept using Fujitsu, XBRLQuery, XBRL Cloud, and any other XBRL processor/XBRL Formula processor that I can get my hands on or get someone else to test.
This may not be the most effecient way to process this, but it does work effectively.
What I can imagine is that the Big 4 CPA firms and other interested parties will provide a lot of valuable input as to what is an allowed financial report configuration under US GAAP and IFRS.
Charlie
in Becoming an XBRL Master Craftsman, Creating Investor Friendly SEC XBRL Filings
|
Post a Comment
|
 3 References
| Email
| Print
3 References
| Email
| Print
Breaking Down the Pieces of an XBRL-based Digital Financial Report
Did you know that on average, creating an XBRL-based report is about logically organizing on average 11 facts correctly for all on average 125 parts in a financial report and making sure none of those 125 parts is logically inconsistent with or logically contradicts any other report part, preferably using effecient and effective automated processes that leverage Lean Six Sigma philosophies and techniques.
Do you realize that the average fact set of an XBRL-based digital financial report has 11 facts. This is skewed a little because a little over half of the fact sets are [Text Block]s. The information below is for a set of 6,023 XBRL-based financial reports submitted to the SEC by public companies:
- Total reports: 6,023
- Total facts reported: 8,532,275
- Average facts per report: 1,416
- Total networks in all reports: 462,786
- Average networks per report: 77
- Total fact sets in all reports: 754,430
- Average fact sets per report: 125
- Average fact sets per network: 1.6
- Average facts per network: 18
- Average facts per fact set: 11
Of the 754,430 fact sets there are:
- Text blocks: 407,392 (54%) are text blocks (Level 1 Notes, Level 2 Policies, Level 3 Disclosures)
- Sets: 181,063 (24%) are sets (or hierarchies, no mathematical computations)
- Roll ups: 120,708 (16%) are roll ups
- Roll forwards: 37,721 (5%) are roll forwards
- Roll forward info: 7,546 (1%) are roll forward infos or something else
If you want to have a look at some fact sets, see: US GAAP | IFRS.
There are over 20 different software applications that can represent this information correctly about 99.24% of the time. On average, about 89.1% of reports can get at least all of the high-level financial information right. There are six software vendors that consistently get all high-level financial information 97% correct.
There are three software vendors that I am testing to make sure they process 10 different fact set patterns to make sure they do so consistently. After they get all of those 10 correct, then we expand to four different reporting scheme profiles, including both IFRS and US GAAP, to be sure those are all processed consistently.
Once they can process an XBRL-based report correctly, then we focus on creating an XBRL-based financial report correctly. The we test their ability to evaluate the report.
My personal view is the the transition from traditional raw XBRL to Inline XBRL is going to allow for the creation of XBRL-based reports to be partitioned into two distinct tasks: modeling the report correctly and mapping the model into an XHTML presentation layer. This transition will cause a positive leap in information quality.
Charlie
in Becoming an XBRL Master Craftsman
|
Post a Comment
| Email
| Print
The Big Picture about Describing XBRL Facts: Set Theory and Class Theory
It is easy to see inconsistencies and other flaws in both the IFRS and US GAAP XBRL Taxonomies. Those inconsistencies and other flaws make it easy to define illogical structures and make paradoxical statements in XBRL-based financial reports that use those base taxonomies.
For example, why do we need to make a distinction between what the US GAAP XBRL Taxonomy referees to as a "[Domain]" and what the IFRS XBRL Taxonomy refers to as a "[member]". Sometimes when you work with the IFRS or US GAAP XBRL Taxonomy you encounter a problem that makes things fall apart. You see this as some sort of inconsistency between the taxonomies or inconsistencies in the XBRL-based reports created by economic entities reporting using those XBRL taxonomies.
Section 1 Background and more specifically Section 1.1.3. Template Taxonomies of the XBRL Dimensions 1.0 specification describes how an XBRL instance is a Cartesian Product of all the domain members of all the dimensions in all the hypercubes of an XBRL instance. The XBRL Dimensions specification uses the terms "primary taxonomies" and "domain member taxonomies" and "template taxonomies":
- Primary taxonomy: Defines primary items or called [Line Items] by the US GAAP XBRL Taxonomy and [line items] by the IFRS XBRL Taxonomy. Basically, these define Concepts and some Abstracts that are used to organize the Abstracts.
- Domain member taxonomy: Defines the Members that make up a domain.
- Template taxonomy: Defines hypercubes and brings the primary taxonomy and the domain member taxonomy together which provides the details of each hypercube.
So something about that explanation is unclear: where are the actual Dimensions defined? The XBRL Dimensions specification does not explicitly say. Could be either the domain member taxonomy or the template taxonomy per that explanation.
Now, the purpose of that detailed explanation (or at least one of the purposes) is to explain that the XBRL Dimensions specification does not break anything in the XBRL 2.1 specification. XBRL Dimensions extends XBRL 2.1 with additional functionally, it breaks nothing.
The Cartesian product is the result of a mathematical operation. It returns a two dimensional matrix of the dimensions of all the facts in all the hypercubes within an entire XBRL instance. This Cartesian product is consistent with set theory.
But the primary items in a primary item taxonomy and the members in a domain member taxonomy have relations also. Those relations are defined by class theory.
XBRL Dimensions defines a domain as a "set of members" (see section 1.1.2. and section 1.3. terminology).
Paraphrasing from this blog post that explains the difference between a class and a set:
- Class: A class is a logical statement that describes any collection of things which have some common property that defines them as a member of that class.
- Set: A set is a class which is a member of some logical class.
- Proper Class: A proper class is a class which is not itself a set.
What is now called "naive set theory" and was the basis for mathematics had some flaws and those flaws were addressed in an updated set theory called Zermelo-Fraenkel Set Theory. Naive set theory is interesting and useful, but when you try to do complicated things in it you encounter problems which makes things fall apart. For example, Naive set theory fails to distinguish between different kinds of things (i.e. like class theory) and that makes it all to easy to use it create paradoxical statements and structures.
The same thing is true about the US GAAP and IFRS XBRL Taxonomies that are used for financial reporting. They are interesting, but when you try and do complicated things with them you encounter problems which make XBRL-based financial reports fall apart, allow for the creation of illogical structures, or create paradoxical statements which should not be allowed because then those consuming information from those reports will get useless information.
As is explained in the document Understanding and Leveraging Fact Sets, the individual pieces of a report are decomposable into pieces. These pieces are described by and fit into sets and classes of things. The FASB, IFRS Foundation, SEC, ESMA and everyone else needs to abide by the mechanical, mathematical, structural, logical, accounting, and other rules that describe financial reports.
Think of all the XBRL-based reports in the SEC's EDGAR system as one big XBRL instance. (You could actually do that you know. For example, imagine all those reports in one database.) You create a gigantic two dimensional Cartesian Product (i.e. Big Data) of all those facts. You look at the dimensions, the members, the primary items, and the facts. All that information should make logical sense.
Or, do the same thing for one fact set from one report. That should make sense. Add a second fact set from some other report that has comparable information. Do the same thing for all companies with that one fact set. Keep building up and building up until you do a comparison of every fact set from every public company. You arrive at the same point: one giant Cartesian Product.
If this is interesting to you, here is more information that you might find interesting:
Charlie
in Becoming an XBRL Master Craftsman
|
Post a Comment
|
1 Reference
| Email
| Print

