BLOG: Digital Financial Reporting
This is a blog for information relating to digital financial reporting. This blog is basically my "lab notebook" for experimenting and learning about XBRL-based digital financial reporting. This is my brain storming platform. This is where I think out loud (i.e. publicly) about digital financial reporting. This information is for innovators and early adopters who are ushering in a new era of accounting, reporting, auditing, and analysis in a digital environment.
Much of the information contained in this blog is synthasized, summarized, condensed, better organized and articulated in my book XBRL for Dummies and in the chapters of Intelligent XBRL-based Digital Financial Reporting. If you have any questions, feel free to contact me.
Entries from March 14, 2021 - March 20, 2021
The Graph, The GRT Token, and Digital Economics
The Graph appears to be an API for querying information in a blockchain. The Graph provides an Explorer. This YouTube Video, Query Ethereum with GQL with The Graph, provides a really good explanation.
The GIF animation is helpful in understanding what you can do with The Graph. Think of a new digital infrastructure for performing work. As this YouTube Video explains you have the following roles:
- Indexers
- Consumers
- Curators
- Delegators
- Fisherman
- Arbitrators
GRT tokens are exchanged by those filling the different roles. For examples, CPAs and CFAs providing machine-readable rules (Curators) that can be used by data aggregators (Consumers) to use XBRL-based financial information from the SEC, ESMA, or other financial information repository. This animated GIF helps to explain:
Interesting stuff! Digital infrastructure is necessary to operate the digital economy.
############################
 Charlie
in Digital Financial Reporting
|
Charlie
in Digital Financial Reporting
|
 Post a Comment
|
Post a Comment
|  Email
|
Email
|  Print
Print
Understanding the Role of XBRL (Brainstorming)
There is more and more really good information coming out about knowledge graphs, artificial intelligence, distributed ledgers, and all the "stuff" that enables the creation of things like a Universal Digital Financial Reporting Framework.
This PowerPoint, Understanding the Role of XBRL, is my brainstorming related to explaining the role XBRL plays in all this. Fundamentally, XBRL is (can be when used correctly) a super-safe and very powerful and appropriately flexible knowledge graph which can be used to represent a general purpose financial report in both human-readable form and machine-readable form. This graphic from Deloitte Germany (which I modified slightly) helps you understand:
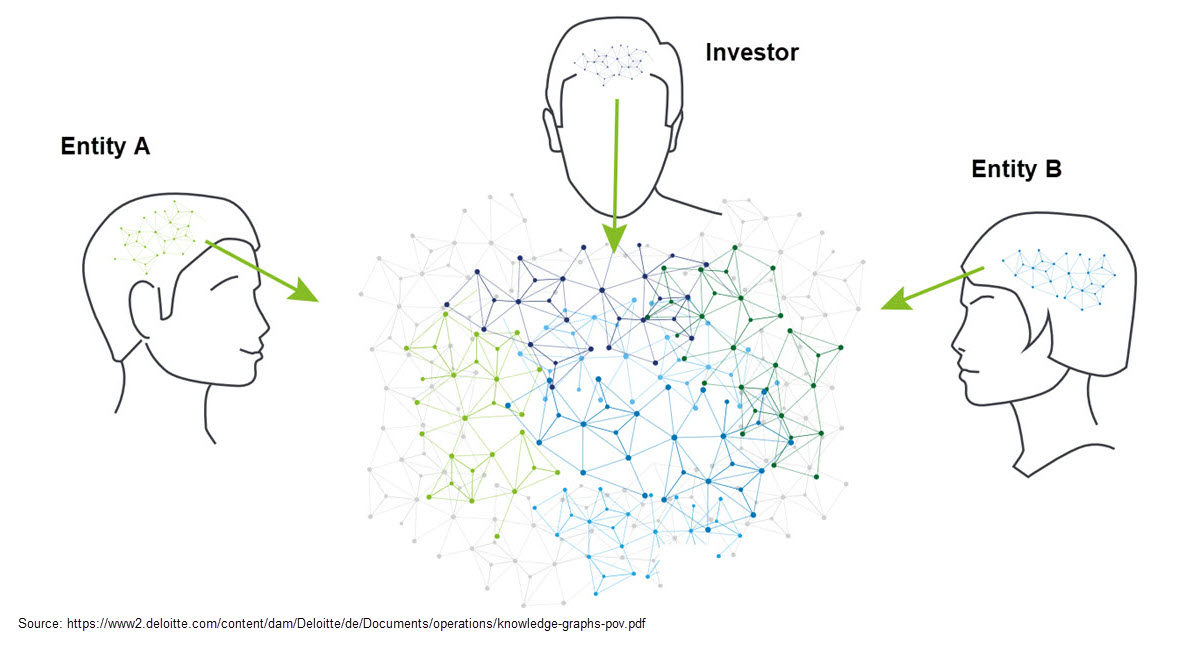
XBRL is used to represent the "stuff" in the center. Flip through the slides for a better explanation. A video is on the way. Working through the current tangle of terminology can set you on the right path. Search my blog for more information about knowledge graphs.
Think supercharged AI.
Charlie
in Digital Financial Reporting
|
Post a Comment
| Email
| Print

