BLOG: Digital Financial Reporting
This is a blog for information relating to digital financial reporting. This blog is basically my "lab notebook" for experimenting and learning about XBRL-based digital financial reporting. This is my brain storming platform. This is where I think out loud (i.e. publicly) about digital financial reporting. This information is for innovators and early adopters who are ushering in a new era of accounting, reporting, auditing, and analysis in a digital environment.
Much of the information contained in this blog is synthasized, summarized, condensed, better organized and articulated in my book XBRL for Dummies and in the chapters of Intelligent XBRL-based Digital Financial Reporting. If you have any questions, feel free to contact me.
Entries from June 13, 2021 - June 19, 2021
XULE
XBRL US created something which they call Xule. Xule is described as follows:
XULE is an expression syntax that allows the querying of XBRL reports and taxonomies using a XULE processor. The XULE syntax has two distinct components. The first is factset selection and the second is taxonomy navigation.
It seems that XBRL US Data Quality Committee rules are written in Xule.
 Charlie
in Digital Financial Reporting
|
Charlie
in Digital Financial Reporting
|
 Post a Comment
|
Post a Comment
|  Email
|
Email
|  Print
Print
Understanding Financial Report Knowledge Graph
Fundamentally, XBRL is a technical syntax that lets you create a "graph" of knowledge, a knowledge graph, for a financial report. What is interesting about XBRL is that each piece of the knowledge graph are rather simple but those pieces can be strung together to create something quite complex such as a 10-K financial report.
Here is a non-standard technical oriented "pointer" to the pieces of a knowledge graph for US GAAP. It is just a list of files that you can look at.
You take specific fragments of that knowledge graph, association them with an XBRL-based financial report, you load all that into a tool that understands the XBRL technical format and you get something that looks like this: (click the image for a larger view, or see this web page)
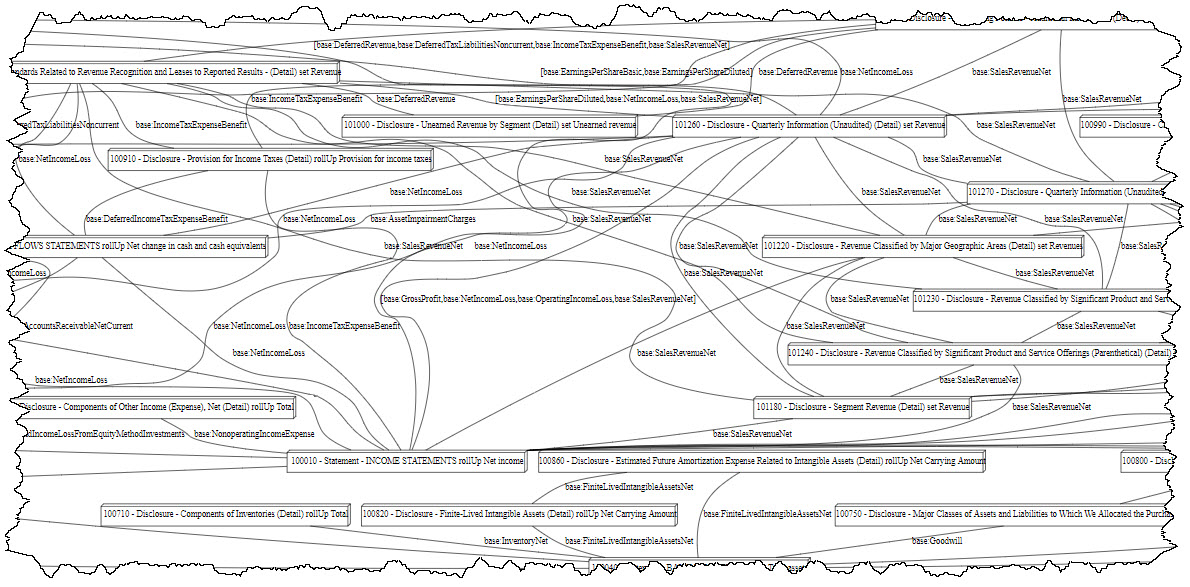
Now, that is a lot of information but that information is not really that useful in that form. Working with that information would be like working in computer assembly language.
But there are tools for working with graphs of knowledge. One of those tools is Neo4j. Here is a small financial report knowledge graph converted from XBRL into Cypher (the syntax of Neo4j) and then loaded into Neo4j. Note the coloring, the sizing of the nodes, etc.:

A more sophisticated financial report might look like the following in Neo4j:
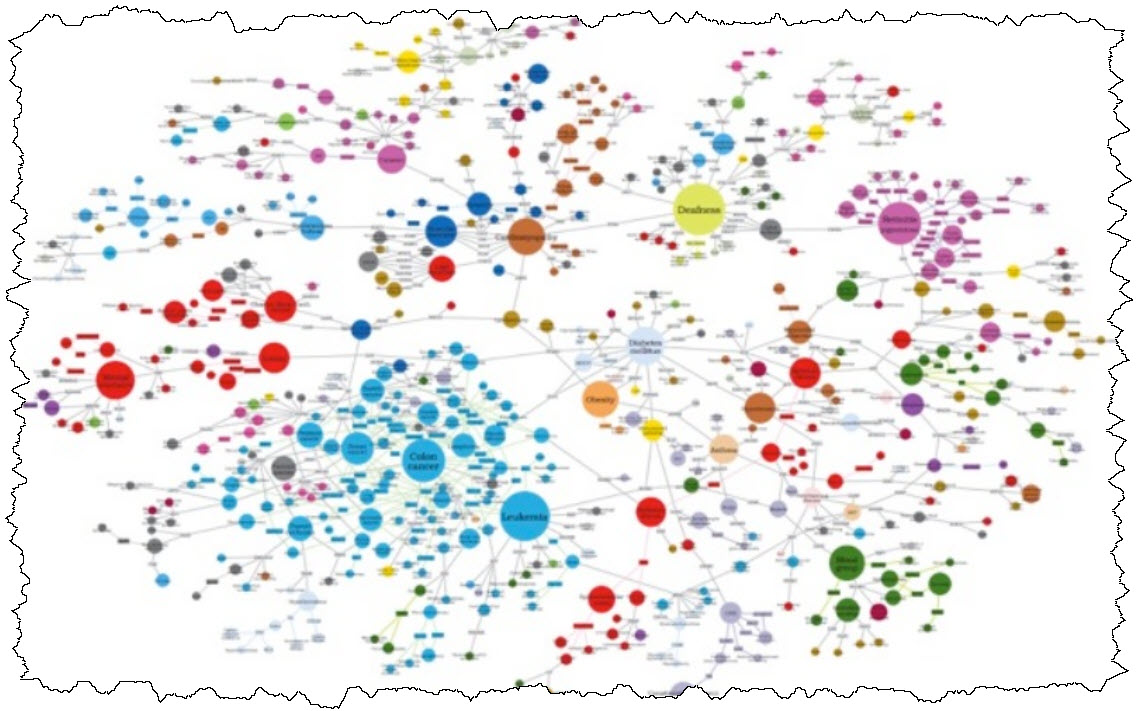
But Neo4j is still a general tool for viewing and working with any knowledge graph. While very useful using, say, a tool like Neo4j's Bloom graph visualization and exploration tool, it is still a general tool and it only gives you general views of a knowledge graph.
But what if you could take that XBRL-based knowledge graph and load it into a tool that was specific to financial reports. That would look something like what you see below:
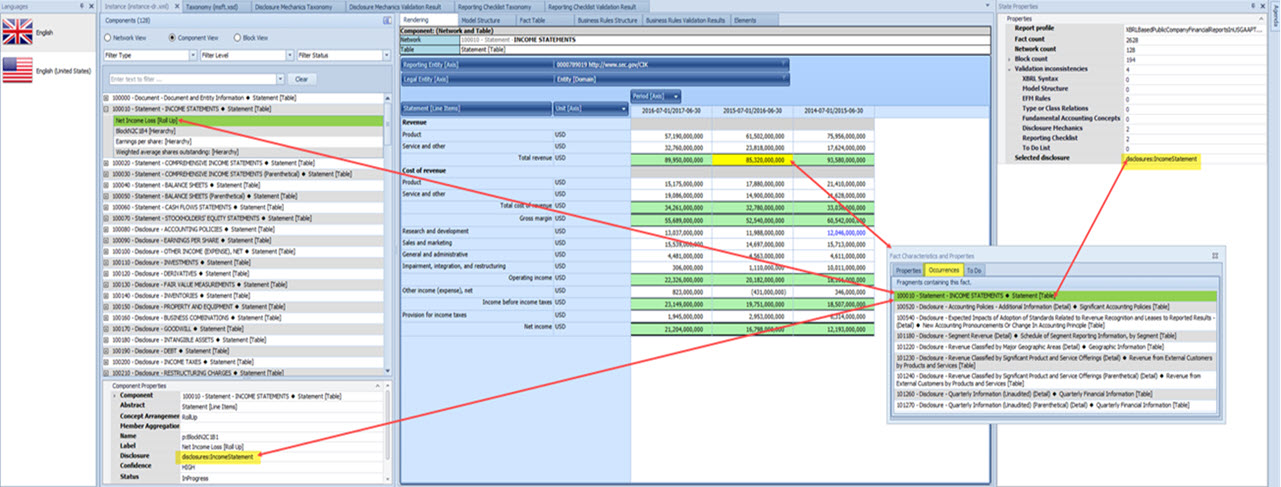
That is the difference between a "general" tool that will work for any area of knowledge and a "specific" tool that is specialize for one specific area of knowledge, in this case financial reporting.
That is the difference between a general tool like Neo4j or Vaticle (was called Grakn) or TopBraid Composer and specialized tools for financial reporting like Pacioli or Pesseract or XBRL Cloud's Evidence Package.
What turns a general tool into a specialized tool? A machine-understandable model. That is why the Logical Theory Describing Financial Report is so critically important. That high level model turns generalized knowledge graphs into specialized knowledge graphs. General tools are not very approachable to business professionals. But specialized tools are very approachable.
You can work at the level of computer assembly language. But why would you?
#############################
Charlie
in Digital Financial Reporting, Knowledge Graphs
|
Post a Comment
| Email
| Print
Function Machine Metaphor
This could be a bit abstract for people, but it is helping me understand relations so I am mentioning it. Here there is this notion of what is called a function machine. A function machine relates to having some object and having a desire to map that first object to some other object. This function machine metaphor helps one understand what is trying to be achieve with what I call type-subtype or wider-narrower or general-special relations.
I have talked about this in terms of whole-part relations previously.
This has to do with set theory, relations on a set. There seem to be three fundamental relation properties that are used to build/describe relations: reflexivity, symmetry, and transitivity. Those terms tend to be too abstract for most business professionals to get their heads around, including myself. Business professionals don’t really care about the underlying theoretical building blocks; they care about what comes out of the function machine when you put something into that machine. HOW the right result is obtained mathematically is of less interest.
Trying to “cram” every relation into the same “function machine”, in the case below “general-special” function machine, is like how “parent-child” relations work in XBRL presentation relations, or rather how different people interpret those relations in different ways and because there is only ONE relation (parent-child) they end up reading meaning into the relationship to suit their needs. This results into many different interpretations. This is partially why the “wider-narrower” rules of the SEC don’t work. They are far too ambiguous.
It seems to me that having many sets of more specific relations is better than one big set of general relations.
One feature of SBRM it seems is that it is far less abstract that OWL/SHACL. I would not under estimate the value of having something more concrete and tangible.
Turning every business professional into a knowledge engineer is never going to happen. Making knowledge engineering ideas simpler for business people to understand has a much higher probability of success.
Charlie
in Digital Financial Reporting
|
Post a Comment
| Email
| Print

