Digital Financial Reporting: The Big Picture in Pictures
Digital financial reporting can be explained by the following graphics. Note that you can click on any of the images to get a larger image. Also note, that this video also covers this information.
First, note that I am seeing the following trends in financial reporting that are evolving in their individual "silos" but will eventually integrate with one another:
- Machine-based digital reporting
- Human-machine collaboration
- Integrated reporting
- Push reporting
- Continuous reporting
- Continuous auditing
- Triple-entry accounting
- Algorithmic analysis/regulation
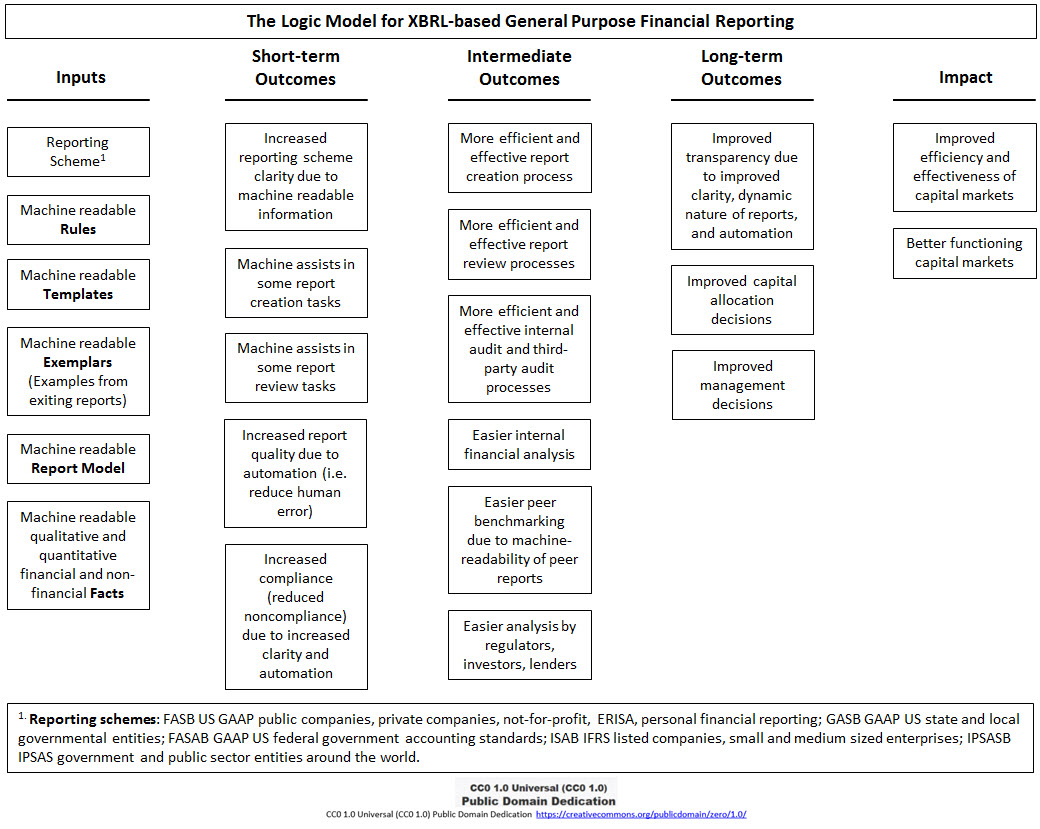
This graphic provided by the Data Coalition shows what they refer to as "Smart Regulation". In the graphic you see that they refer to "standard data models" (i.e. machine-readable rules) and the "engines of automation" (i.e. rules engines and artificial intelligence):
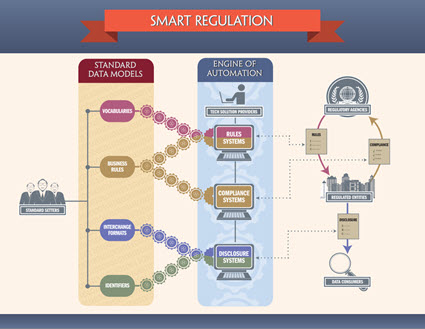
It is not going to be the case that enterprises keep their same old systems and "bolt on" new stuff, doing more work, just so that they can make regulation more efficient (but remain inefficient internally). And it will not be the case that each enterprise creates it's own model. Think of the notion of a global standard common enterprise model for any organization to improve their internal processes and tasks.
The inner workings or processes and tasks of a financial reporting system of a typical enterprise is explained by this graphic inspired a Blackline graphic related to continuous accounting which I built on:
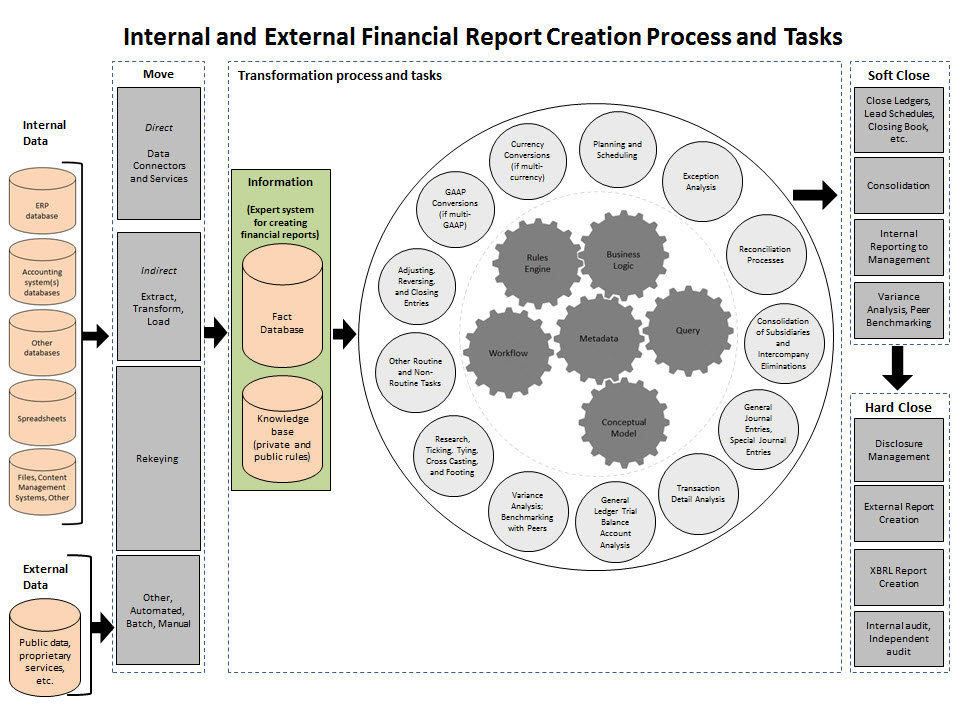
Those processes and tasks are the candidates for automation. Will everything be completely automated? That is very doubtful. Will nothing be automated? That is likely doubtful also. The answer will be somewhere in between today's grueling, barbaric manual processes and the notion of "lights out finance" where the entire process is totally automated.
So, how will that automation be achieved?
This graphic, inspired by a similar graphic created by Dr. Leo Obrst and Mills Davis on slide 60 of this SlideShare presentation, shows the relationship between knowledge representation capability of different technical approaches and of reasoning capacity that can be achieved within a software application:
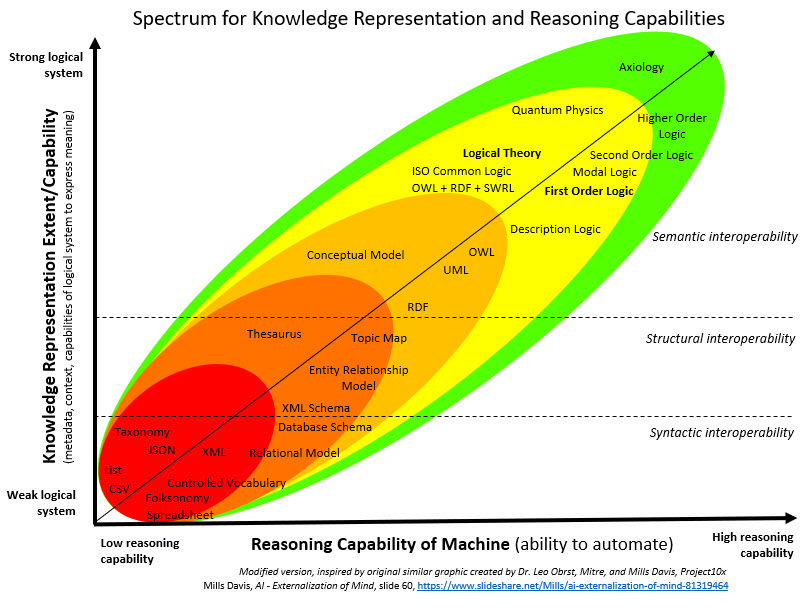
Note that there are many alternative approaches, each has its set of capabilities, many different ways will work, and a logical theory is one of the better approaches because it is highly expressive.
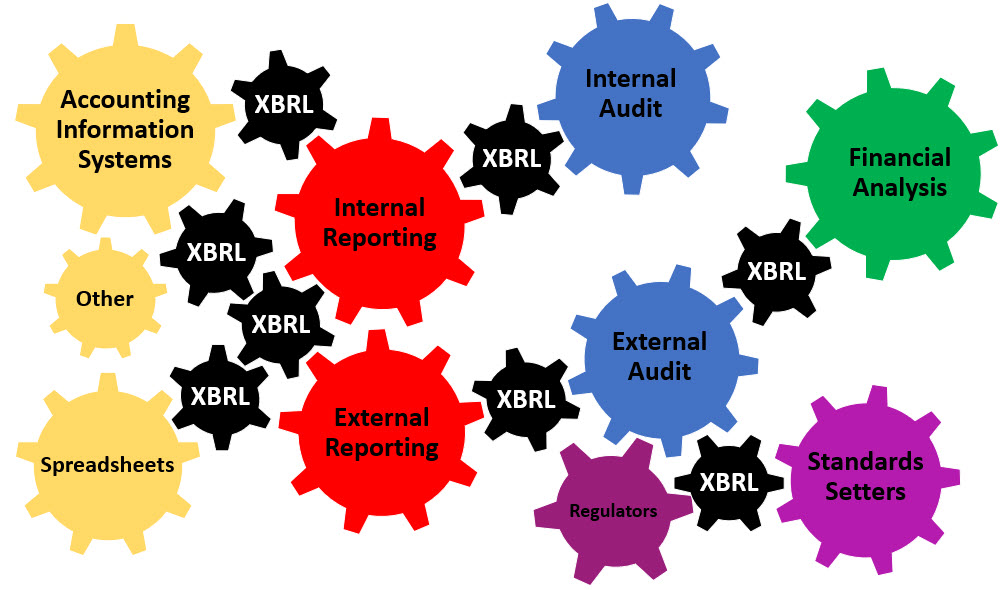
This graphic shows how global standard XBRL can be used to link different aspects of accounting, reporting, auditing, and analysis together so that information can be exchanged between tasks and processes:
So that is the big picture in pictures. This example small system helps you understand the details of how all this actually works.
I provide a more complete explain of the moving parts in the document Special Theory of Machine-based Automated Communication of Semantic Information of Financial Statements. This video play list, Understanding the Financial Report Logical System, provides an overview of that document.
To understand that document, it is best if you read Artificial Intelligence and Knowledge Engineering in a Nutshell go get important background information.
Why do any of this?
As pointed out in the Accountant's Handbook on page 3 (D. R. Carmichael, O. Ray Whittington, Lynford Graham); financial reporting benefits society and improving financial reporting increases that benefit:
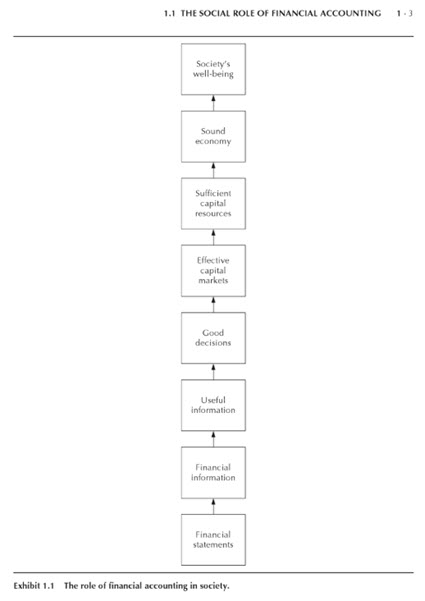
And so, the business case for XBRL-based digital financial reporting is better functioning capital markets and an improvement in the well being of society:
What do you think?
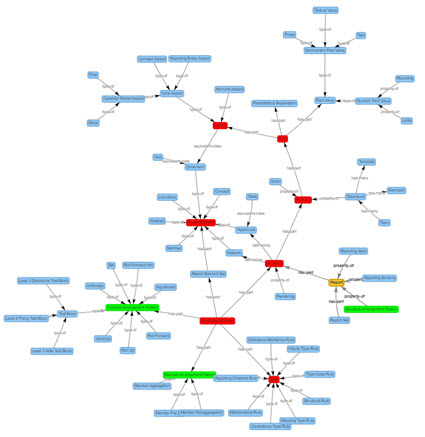
Here is a visualization of the logical conceptualization of a financial report. The Financial Report Semantics and Dynamics Theory has the same logical conceptualization in narrative form. The OMG Standard Business Report Model (SBRM) standardizes and formalizes that model. XBRL is a global standard technical syntax for implementing that formal logical conceptualization.
And so, what will this look like for accounting professionals, financial analysts, and other business professionals? Well, here is one version of what it will look like:
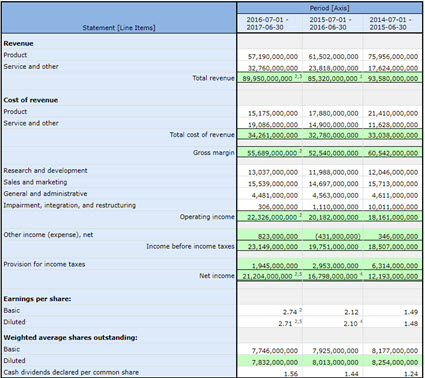
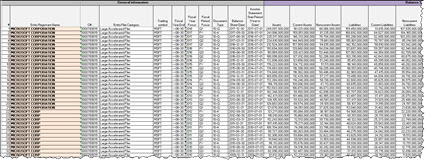
But it could look like many different things because software can reconfigure the pieces to suit your needs. For example, it might look like this Excel-based automated comparison of 33 Microsoft financial statements (click the image to run the Microsoft comparison or any comparison of 22 other public companies; alternatively, try one of these Excel extraction tools that compare information for thousands of public companies):
The possibilities are endless, digital financial reporting is just getting started! If you want more details, Intelligent XBRL-based Digital Financial Reporting likely has what you are looking for.
 Charlie
in Digital Financial Reporting
|
Charlie
in Digital Financial Reporting
|
 Post a Comment
 View Printer Friendly Version
 Email Article to Friend
Reader Comments