Human Readable Rendering is the Creation Interface for XBRL
I have been exprimenting with how to get from an XBRL instance to a human readable rendering since about 2007 I figure. What if these same techniques in the creation of business reports(i.e. the XBRL)?
When working to create XBRLS the notion of a "neutral format template", or a basic rendering came to mind. Then the idea that a business report is nothing more than a bunch of pivot table-type objects. Then I thought that BI (business intelligence) software could be used as an interface, but BI had limitations: it forces OLAP on you, it does not handle text well, and it is really meant for read only not read/write. Over the years I have used other terms to refer to the notion of a neutral format template: neutral format table, interactive business document, interactive information hypercube.
Here are some examples of what these neutral format templates look like:
All the information that I have seen can be condensed down into about nine metapatterns. Here renderings of each of the nine metapatterns: hierarchy, roll up, roll forward, compound fact, adjustment, variance, complex computation, text block, grid(not really a metapattern, but it is used in the US GAAP taxonomy). Believe it or not, everything that exists in the US GAAP taxonomy and everything that I have seen in SEC XBRL financial filings fits into one of these nine metapatterns. What if I am wrong? What if there are more than nine? Fine, add some more; maybe there are 15 or 25 or maybe even 50 metapatterns. The point is: the information is not random, there is a pattern!
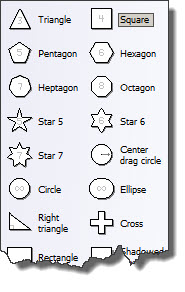
The idea of leveraging patterns or metapatterns or templates to make working with computers is not my idea or even a new idea. For example, look at these Microsoft Visio shapes or stencils. What is easier to create: (a) a triangle by dragging and dropping the shape/stencil or (b) a triangle by building the triangle yourself from lower level objects?

These same ideas apply to working with XBRL. Below is one screen shot of a neutral format table, you can see a complete set here.

Clearly I am not an artist and my color selection is poor; but what if creating an XBRL instance and XBRL taxonomy was as simple as editing that table. It guides you through the process of "extending" a taxonomy. It only lets you extend the taxonomy where it is logical.
Just like creating that triangle in Visio by dragging and dropping an existing triangle and adjusting the properties such as its size (rather than drawing each line and connecting them correctly, etc.); a financial statement is a collection of stencils or templates or tables. You can modify the stencil, adding line items to your balance sheet. The template will not let you change the fundamental nature of a balance sheet: all balance sheets have certain characteristics, core financial semantics. Those core semantics, which each template has, are expressed using business rules (XBRL formulas) and they "glue" the information set together.
So, why can't this work? If a human readable rendering can be generated using the information contained within the XBRL instance and XBRL taxonomy and the information about the nine fundamental metapatterns (or whatever number we come up with) is leveraged to render that information correctly; then why can't that same rendering be used to create the business report and then generate the XBRL output (and HTML, PDF, Excel, Work, or whatever other format you might care for)? The business rules such as those core financial reporting semantics hold the pieces together and software won't let you break those core rules.
Or do people really enjoy working at the level of the XBRL technical syntax?

Reader Comments