SECXBRL.info Opens Up New Dimensions for Testing SEC Financial Filings
I have been severely limited in terms of the testing (poking and prodding) of SEC XBRL financial filings that I have been able to do in the past because of three things.
- I had to write my own tools
- My limited programming skills
- To make things easier, I focused on one period at a time
- Information was stored correctly, but in individual files so querying was slow
Those limits no longer apply. SECXBRL.info changes all of that. Why?
#1: Easy queries
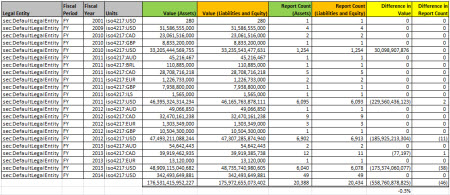
First off, the information is stored in a properly organized database which makes two things happen: (a) query execution is fast, (b) queries are easy to write. Consider this summary of all SEC XBRL financial filings:
That is the result of two queries (links are provided for the queries), one for the value of assets and another for the value of liabilities and equity. Those queries take into consideration amended filings. They take into consideration that filers use different concepts to report liabilities and equity. They take into consideration something that I had totally missed, that not all filers report in US dollars.
So the SECXBRL.info API does a lot of stuff for you behind the scenes, so you don't have to deal with it. I know how to use a REST API, it is not that hard. I can program in Microsoft Excel and/or Microsoft Access using VBA. I used to have to deal with a lot of stuff in my code that I no longer need to deal with.
Take a look at that image above again. Click on it for a larger view. Accountants understand the accounting equation: Assets = Liabilities and equity. So it seems to me that it is logical to expect a query of "Asset" and a query of "Liabilities and equity" across all the filings to return the same values. Right? You might also expect that the number of filings count would be the same. But they are not. Why? Well, either the filings are wrong or the software doing the query is wrong.
Saying this another way, doesn't it seem reasonable that the SEC EDGAR system have a "dashboard" of some sort to make sure all the information in the system is correct? Seems to me that would help one manage the system, help keep the quality high, errors out of the system.
#2: Information for all periods
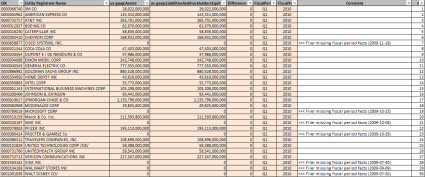
So the second thing I can do is query across many periods because of #1 (easy queries) and all the information exists in the database, not just one period. Here is something new that I can do. Consider this graph of the first quarter of SEC XBRL financial filings, this is information for the DOW 30, Q1, 2010:
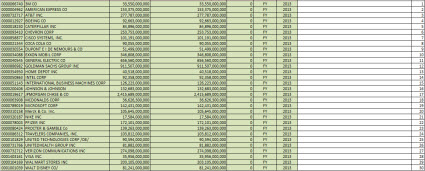
What you see is that for seven of the 30 DOW companies, they did not provide the fiscal period focus or fiscal year focus information in their filing. Therefore, you cannot tell with fiscal period the information relates to. Contrast the image above to the same information for the DOW 30 for fiscal year 2013:
Quite a contrast, EVERY reporting entity in the DOW 30 now provides that fiscal period focus and fiscal year focus information. What does that mean? Reported information is improving and better queries are therefore possible.
Now, I am showing the DOW 30 because of the strong contrast between the 2010 filings and the 2013 filings in terms of providing the fiscal period and fiscal year focus information. This does not explain why the balance sheets do not balance for all financial reports within the SEC EDGAR database of SEC XBRL financial filings. In fact, it shows the opposite; it shows that they SHOULD balance because all of these balance for the DOW 30.
Here is why the overall dashboard does not balance:
If you click on that image you see that Chrysler used the extension concept which they created, "chlr:LiabilitiesAndMembersDeficitInterest", to report liabilities and equity. Therefore, the software could not find the reported value. And so there is a value for assets and no value for liabilities and equity and therefore (a) this balance sheet does not balance and (b) it is impossible for all the balance sheets to balance and total assets of all SEC filings to equal total liabilities and equity of all SEC filings.
This analysis shows (this graphic specifically, test BS2) that assets and liabilities and equity was detectable for 99.6% or all but 29 SEC XBRL financial filings. It also shows that balance sheets balance for 6593 of 6622 SEC XBRL financial filings. As such, it would be quite hard for a filer to justify not having a detectable concept for assets or liabilities and equity and that those to values be the same within the same context. Very hard to justify.
If you download this ZIP file which contains an Excel spreadsheet you will find information related to the DOW 30, the Fortune 100, and the S&P 500. The information shows whether the balance sheet balances, whether the root economic entity could be found at all, and information about the fiscal period focus and the fiscal year focus.
All that information was obtained from the SECXBRL.info API using this very easy to use query. Looking at the parts of the query:
- Base query: http://secxbrl.xbrl.io/v1/_queries/public/api/facts.jq?
- Technical stuff:_method=POST&format=xml
- Concept: &concept=us-gaap:Assets
- Another concept: &concept=us-gaap:LiabilitiesAndStockholdersEquity
- CIK number: &cik=0000066740
- Fiscal period: &fiscalPeriod=FY
- Fiscal year: &fiscalYear=2013
You can fiddle with that by reading the API documentation, these example basic query examples which I created, or use this Excel application example to see how to write code.
# 3: Query hierarchical information
Most Excel users limit themselves unnecessarily. Excel is one tool, it is not the only tool. Microsoft sells another tool called Microsoft Access. It is a relational database. Excel is not a relational database. You can make Excel mimic what a relational database does to a degree using VLOOKUP or HLOOKUP functions. They get the job done in many cases, sort of. But if you understand how to use a relational database, such as Microsoft Access, you can do WAY, WAY, WAY more and doing it is substantially easier. Why? Because that is what relational databases do, they are really good at relating data.
Now, the same deal goes with Microsoft Access. It is one tool. While you can query hierarchical information using a relational database such as Access, it is harder to do that then using a tool which was built to do hierarchical queries.
So, the information within SECXBRL.info is laid out in terms of the meaning of the information. That information is represented in a lot of cases hierarchically. A relational query is not the best tool for doing a hierarchical query. You can do it, but it is not the best tool. You can pound a nail in with a crescent wrench, but a hammer works better.
The SECXBRL.info platform can do relational type queries, no problem. But they can also to queries across a hierarchy. The global standard XQuery is used for that. In fact, SECXBRL.info went two steps better. First, they use a third party extension of the global standard XQuery called JSONiq. That allows you to do lots of additional stuff such as use the JSON syntax if you prefer that over XML. Second, it has built in stuff to enhance query performance. I don't really understand that, multi-threading, load balancing, things like that. Personally, I don't care how it happens, I just enjoy the performance.
What this means is that you can write incredibly powerful queries which are beyond what most people today would even thing to query. I will write more on this later, but experience if for yourself by fiddling around with the "Compare & Search" functionality. I am not providing links because they are going to make some improvements to the GUI and so the links might change. Check back later, I will provide more information on querying hierarchies.
Bottom line
The bottom line here is that I can do way, way more poking and proding. Further, many others can also start poking and proding all those SEC XBRL financial filings. With the quantity and quality of tools increasing, it is going to be harder and hard for public companies, filing agents, software vendors, or others to get away with the poor quality filings that they have gotten away with in the past.
The quantity and quality of digital financial reporting tools will continue to increase. In fact, I believe that the pace of the increase will speed up.


Reader Comments