Financial Report Knowledge Graphs
"The reasonable man adapts himself to the world; the unreasonable one persists in trying to adapt the world to himself. Therefore all progress depends on the unreasonable man." -- George Bernard Shaw
Be unreasonable.
Financial Report Knowledge Graphs helps professional accountants understand that financial reports are knowledge graphs. In the past these financial report knowledge graphs were readable only by humans. Today with XBRL-based financial reports these financial report knowledge graphs are also readable by machines.
If you think about it you will quickly recognize that the knowledge in those knowledge graphs are the same knowledge for different parties that use that knowledge:
- The set of logical statements that is used to specify/describe how a report should be created (say by a regulator or standards setter),
- The set of logical statements used to actually create a report (say an accountant),
- The set of logical statements used to verify that the report was created consistently to the specification/description (say an accountant or software application used by an accountant),
- The set of logical statements used to independently confirm that the report was created consistently with the specification/description (say by an independent auditor),
- The set of logical statements used to extract information from the created report (say by a financial analyst or regulator).
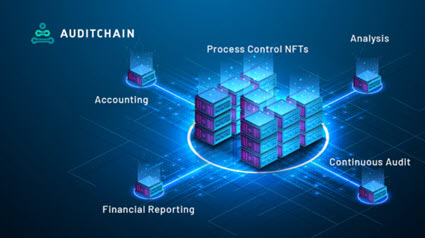
This realization is depected well in this graphic created by Auditchain. A lot of that knowledge will be instantiated in the form of NFTs. Those NFTs, which will be created by accountants (see The Economics of Digital for CPAs) and will control processes. If you are trying to understand this using the paradigm that has in place for the past 100 years, you will not understand. You need to adjust your thinking, here are the new rules.
What does a professional accountant need to understand in order to position herself or himself appropriately for the next 25 years? There are two key things that business professionals intuitively or innately understand:
- Fundamentals of knowledge graphs (see Financial Report Knowledge Graphs)
- Computational thinking (see Algorithmic Business Thinking and Computational Professional Services)
Modern accounting is on its way. Traditional audit is doomed.
###########################
 Charlie
in Digital Financial Reporting
|
Charlie
in Digital Financial Reporting
|
 Post a Comment
 View Printer Friendly Version
 Email Article to Friend
Reader Comments