XBRL is a Knowledge Graph
Earlier this week I watched a video on the Auditchain web site relating to a demonstration of the DCARPE Explorer. There was an interesting graphic between 52 seconds and 1 minute 9 seconds in the video that had a grid of facts. A few days later I was talking to Jason Meyers, the CEO of Auditchain, and he brought that graphic up and explained it. That gave me an idea that explains two things.
First, I have pointed out before that an XBRL-based digital financial report is a finite, discrete set of statement. This graphic shows this visually; each GREEN square represents a discrete statement that is verified to be correct, each ORANGE square represents a discrete statement that is worth looking at in more detail, and each RED is an error: (click the image for a prototype HTML page)
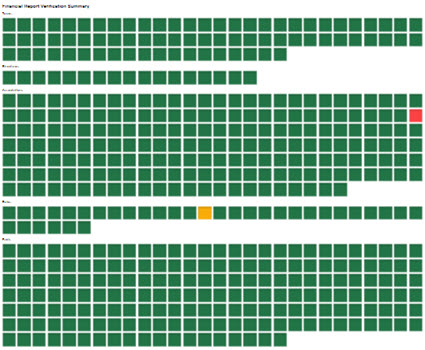
Here are similar representations for the accounting equation, SFAC 6 elements of financial statements, my Proof representation, and for the 2017 Microsoft 10-K financial report. The bigger the report, the more "squares" or pieces of the report. For example, the Microsoft 10-K has:
- 899 terms
- 128 structures
- 3,296 associations
- 0 rules (i.e. XBRL Formulas, XBRL calculation associations are counted in the associations above)
- 2,235 facts
So, you have a set of discrete statements and you need to verify that each of the statements is correct. The accounting equation has fewer statements, SFAC 6 a few more, the Proof has more, and the real Microsoft 10-K has the most.
That flat list hs useful, but you cannot see the assocations between the statements. Another useful view of the information or statements made by the report is that of a knowledge graph. Here is a partial knowledge graph for SFAC 6 created using Neo4j: (click the image for a larger view)

In the knowledge graph above of SFAC 6 you can see the assications between the individual discrete pieces of information.
That same information can also be rendered in human readable form. Here is the human readable form for the accounting equation, SFAC 6, the Proof, and Microsoft 10-K. The rendering is simply a reorganizing of the same statements that you see in the flat list, the knowledge graph, or the XBRL tecnnical syntax: (click image for larger view)
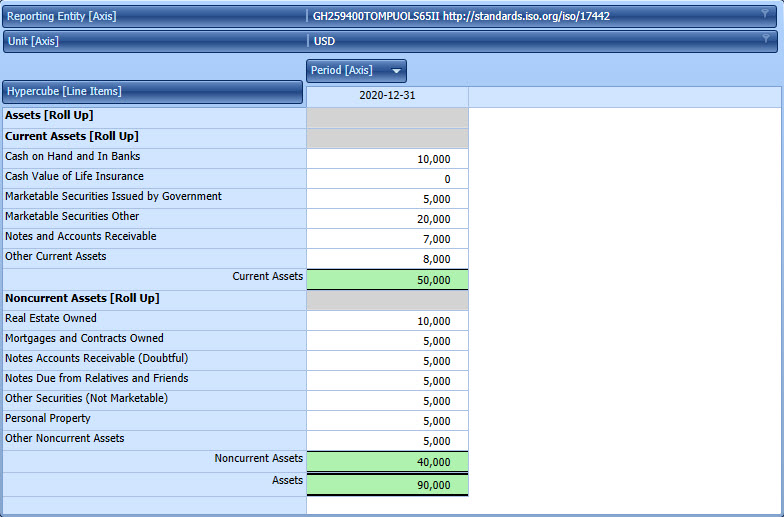
XBRL is effectively a knowledge graph. You could express that same information in Cypher, Prolog, RDF+OWL+SHACL (or some other rules language), or some other problem solving logic paradigm.
Whatever syntax you prefer you still need to understand the logic and how to work with knowledge graphs effectively. If you want to learn about these important knowledge graphs, study the Microsoft 10-K.
#############################
 Charlie
in Digital Financial Reporting, Knowledge Graphs
|
Charlie
in Digital Financial Reporting, Knowledge Graphs
|
 Post a Comment
 View Printer Friendly Version
 Email Article to Friend
Reader Comments