BLOG: Digital Financial Reporting
This is a blog for information relating to digital financial reporting. This blog is basically my "lab notebook" for experimenting and learning about XBRL-based digital financial reporting. This is my brain storming platform. This is where I think out loud (i.e. publicly) about digital financial reporting. This information is for innovators and early adopters who are ushering in a new era of accounting, reporting, auditing, and analysis in a digital environment.
Much of the information contained in this blog is synthasized, summarized, condensed, better organized and articulated in my book XBRL for Dummies and in the chapters of Intelligent XBRL-based Digital Financial Reporting. If you have any questions, feel free to contact me.
Entries in Knowledge Graphs (10)
Understanding Financial Report Knowledge Graph
Fundamentally, XBRL is a technical syntax that lets you create a "graph" of knowledge, a knowledge graph, for a financial report. What is interesting about XBRL is that each piece of the knowledge graph are rather simple but those pieces can be strung together to create something quite complex such as a 10-K financial report.
Here is a non-standard technical oriented "pointer" to the pieces of a knowledge graph for US GAAP. It is just a list of files that you can look at.
You take specific fragments of that knowledge graph, association them with an XBRL-based financial report, you load all that into a tool that understands the XBRL technical format and you get something that looks like this: (click the image for a larger view, or see this web page)
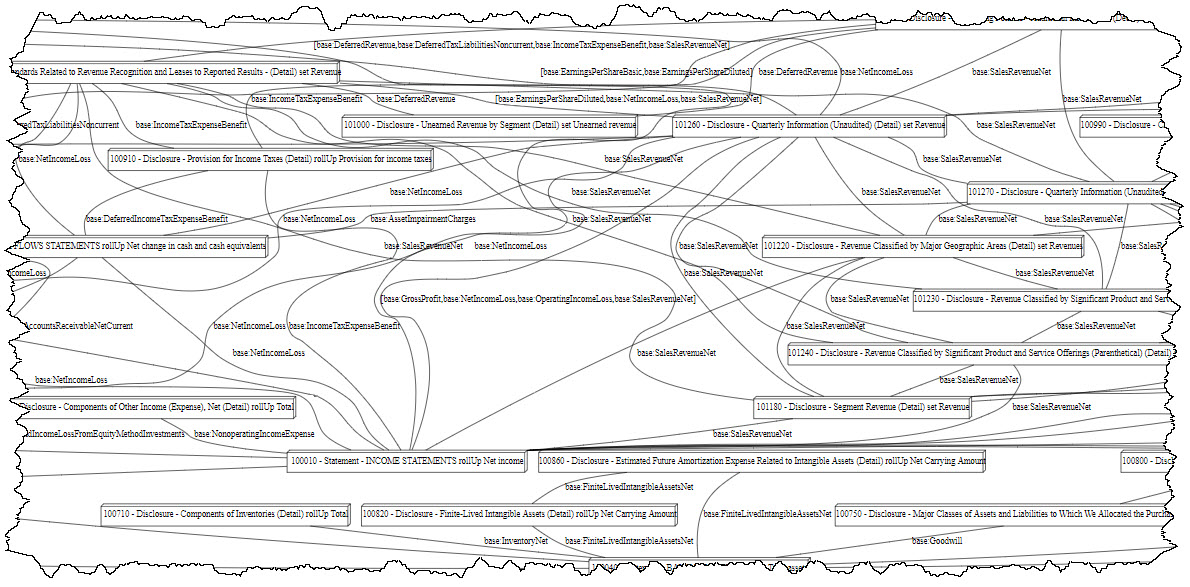
Now, that is a lot of information but that information is not really that useful in that form. Working with that information would be like working in computer assembly language.
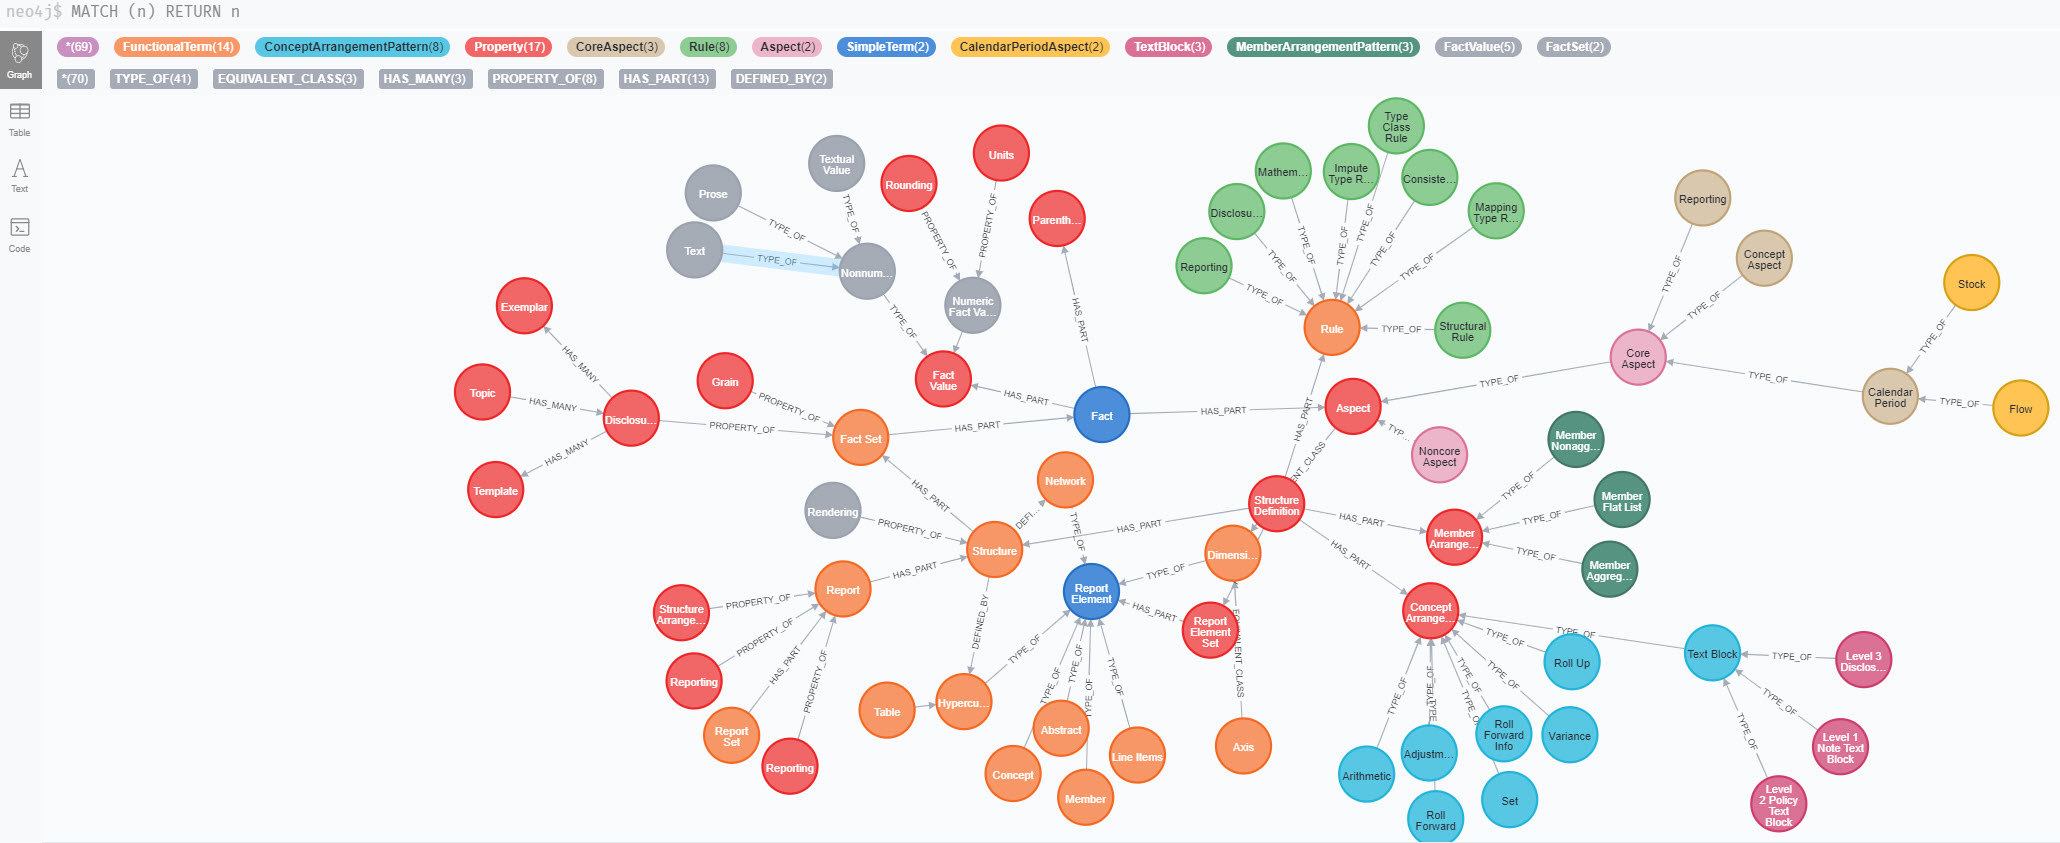
But there are tools for working with graphs of knowledge. One of those tools is Neo4j. Here is a small financial report knowledge graph converted from XBRL into Cypher (the syntax of Neo4j) and then loaded into Neo4j. Note the coloring, the sizing of the nodes, etc.:

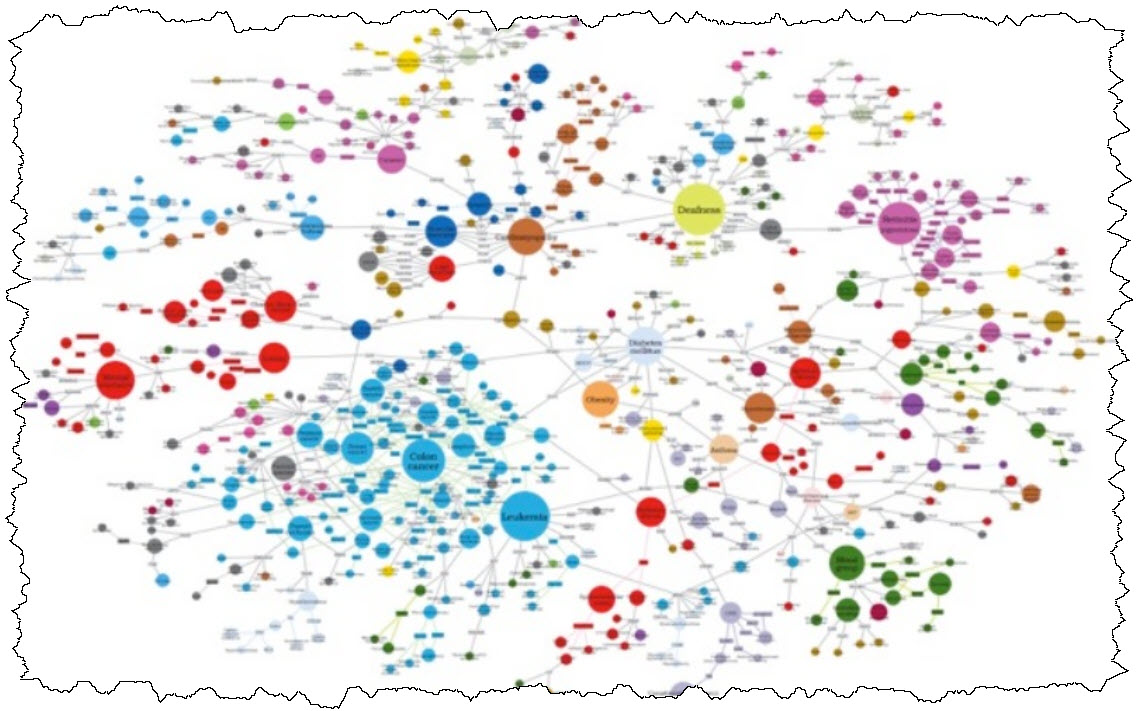
A more sophisticated financial report might look like the following in Neo4j:
But Neo4j is still a general tool for viewing and working with any knowledge graph. While very useful using, say, a tool like Neo4j's Bloom graph visualization and exploration tool, it is still a general tool and it only gives you general views of a knowledge graph.
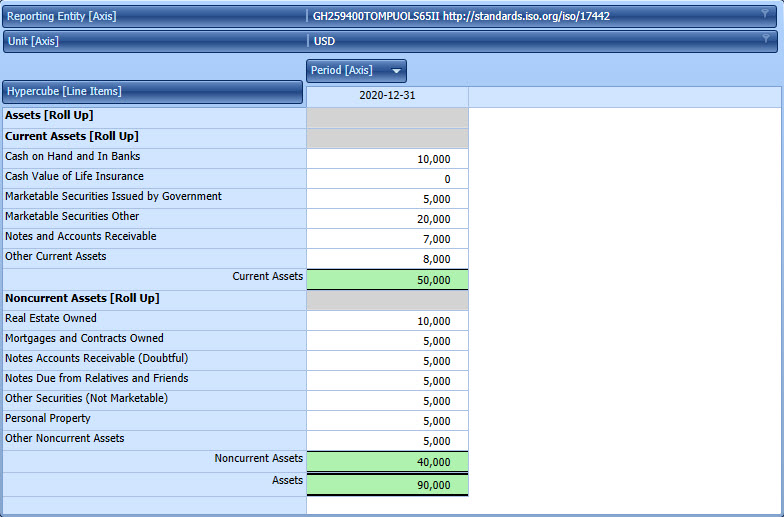
But what if you could take that XBRL-based knowledge graph and load it into a tool that was specific to financial reports. That would look something like what you see below:
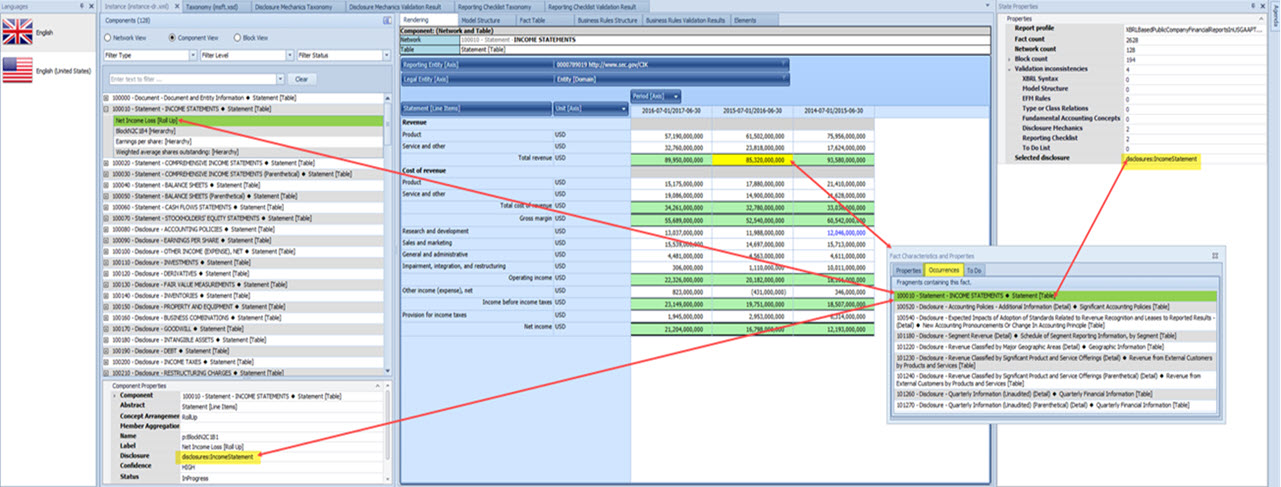
That is the difference between a "general" tool that will work for any area of knowledge and a "specific" tool that is specialize for one specific area of knowledge, in this case financial reporting.
That is the difference between a general tool like Neo4j or Vaticle (was called Grakn) or TopBraid Composer and specialized tools for financial reporting like Pacioli or Pesseract or XBRL Cloud's Evidence Package.
What turns a general tool into a specialized tool? A machine-understandable model. That is why the Logical Theory Describing Financial Report is so critically important. That high level model turns generalized knowledge graphs into specialized knowledge graphs. General tools are not very approachable to business professionals. But specialized tools are very approachable.
You can work at the level of computer assembly language. But why would you?
#############################
 Charlie
in Digital Financial Reporting, Knowledge Graphs
|
Charlie
in Digital Financial Reporting, Knowledge Graphs
|
 Post a Comment
|
Post a Comment
|  Email
|
Email
|  Print
Print
2020 Was The “Year of the Knowledge Graph”
2020 was the "year of the Knowledge Graph". As I have pointed out, XBRL is a knowledge graph devised in 1999, long before Google came up with the term "knowledge graph" in 2012. Prolog, RDF, SQL, GQL are also all declarative approaches to representing knowledge graphs.
The take away from the article above is:
For knowledge graph technologies to have a broader impact, we shouldn’t be dogmatic about a term that was invented by Google’s product marketing department. We shouldn’t insist on adoption of standardized markup schemes or the creation of a centralized graph database because that didn’t work for the Semantic Web, and it won’t work for the corporate web.
If we instead listen to the problems information workers have, spend a day shadowing them in their jobs, and design solutions that integrate knowledge-tech in a lightweight way to automate tedium, then we have a shot at solving a larger set of problems, to benefit more of society.
Linked to the article above is this excellent article by some folks from Deloitte in Germany: Wisdom of Enterprise Knowledge Graphs. If you read nothing else, read the CONCLUSION of that document. But the entire document is worth reading.
Have a look at what you can do with a knowledge graph in this 3 minute YouTube video. They are using KgBase. Accountants (and others) can learn about knowledge graphs for free.
Remember, an XBRL-based digital financial report is a knowledge graph.
####################################
What is Small Data (YouTube Video)
Generating Small Data can Solve Big Problems (TedTalk)
Charlie
in Digital Financial Reporting, Knowledge Graphs
|
Post a Comment
| Email
| Print
Accountants can Learn about Knowledge Graphs for Free
Here are two very good FREE resources for understanding knowledge graphs and graph databases. O'Reilly is publishing a book, Graph Databases, which can be downloaded for free. It has a few ads from Neo4j at the very beginning.
Neo4j provides the Neo4j Sandbox which is a cloud-based graph database implementation that you can spin up in your web browser. To get started with Neo4j you can watch this video (about 15 minutes) and/or work through this Neo4j tutorial.
There are plenty of other graph databases such as TigerGraph and Grakn. Each has pros and cons. I will use Neo4j to provide some examples for you.
The Neo4j syntax is Cypher. Here is a Cypher example that you can load into Neo4j for the FASB's SFAC 6 Elements of Financial Statements. When you load the Cypher example, it will look something like this in Neo4j: (Click image for larger view)
As I pointed out, accounting is an area of knowledge that can be organized into a knowledge graph. There are principles for using knowledge graphs properly. The Cypher syntax is one approach to organizing and using this information. XBRL is another. Prolog is another. You can convert bidirectionally between Cypher, XBRL, Prolog, and RDF+OWL+SHACL.
Here is my Logical Theory Describing Financial Report. Here is the essence of that theory represented in Cypher syntax. When you put the Cypher into the Neo4j graph database sandbox, it will look like this: (click image for larger view)
Another view of the same information is this representation in Javascript. Here is that same information in the XBRL syntax. This is a human readable rendering of the XBRL.
XBRL is both machine-readable and can be easily converted to machine-readable. XBRL syntax can be converted to the technical syntax of your choice. What is consistent between all of these representations is the logic that is represented.
If you distill accounting down to its essence the importance and potential ramifications of all this becomes quite clear. If you want to learn how to represent information using XBRL, here are the essentials. Here are a bunch of really good accounting related examples. Here is what you need to master XBRL-based digital financial reporting.
Don't be left behind.
Charlie
in Digital Financial Reporting, Knowledge Graphs
|
Post a Comment
| Email
| Print
XBRL is a Knowledge Graph
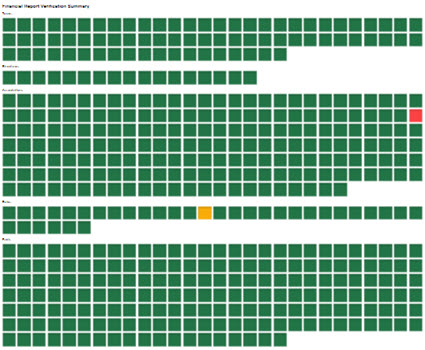
Earlier this week I watched a video on the Auditchain web site relating to a demonstration of the DCARPE Explorer. There was an interesting graphic between 52 seconds and 1 minute 9 seconds in the video that had a grid of facts. A few days later I was talking to Jason Meyers, the CEO of Auditchain, and he brought that graphic up and explained it. That gave me an idea that explains two things.
First, I have pointed out before that an XBRL-based digital financial report is a finite, discrete set of statement. This graphic shows this visually; each GREEN square represents a discrete statement that is verified to be correct, each ORANGE square represents a discrete statement that is worth looking at in more detail, and each RED is an error: (click the image for a prototype HTML page)
Here are similar representations for the accounting equation, SFAC 6 elements of financial statements, my Proof representation, and for the 2017 Microsoft 10-K financial report. The bigger the report, the more "squares" or pieces of the report. For example, the Microsoft 10-K has:
- 899 terms
- 128 structures
- 3,296 associations
- 0 rules (i.e. XBRL Formulas, XBRL calculation associations are counted in the associations above)
- 2,235 facts
So, you have a set of discrete statements and you need to verify that each of the statements is correct. The accounting equation has fewer statements, SFAC 6 a few more, the Proof has more, and the real Microsoft 10-K has the most.
That flat list hs useful, but you cannot see the assocations between the statements. Another useful view of the information or statements made by the report is that of a knowledge graph. Here is a partial knowledge graph for SFAC 6 created using Neo4j: (click the image for a larger view)
In the knowledge graph above of SFAC 6 you can see the assications between the individual discrete pieces of information.
That same information can also be rendered in human readable form. Here is the human readable form for the accounting equation, SFAC 6, the Proof, and Microsoft 10-K. The rendering is simply a reorganizing of the same statements that you see in the flat list, the knowledge graph, or the XBRL tecnnical syntax: (click image for larger view)
XBRL is effectively a knowledge graph. You could express that same information in Cypher, Prolog, RDF+OWL+SHACL (or some other rules language), or some other problem solving logic paradigm.
Whatever syntax you prefer you still need to understand the logic and how to work with knowledge graphs effectively. If you want to learn about these important knowledge graphs, study the Microsoft 10-K.
#############################
Charlie
in Digital Financial Reporting, Knowledge Graphs
|
Post a Comment
| Email
| Print
Enterprise Knowledge Graph Principles
The Enterprise Knowledge Graph Foundation has published a set of principles for an Enterprise Knowledge Graph (EKG).
A knowledge graph is one approach to storing information within a knowledge base. The article, What is a Knowledge Graph? is an explanation of what a knowledge graph is (and isn't) and the difference between a knowledge base and a database. You can download the knowledge base GraphDB here. This is a quick start guide for GraphDB. Or, you can fiddle around in the Neo4j Sandbox here.
This is an excellent article that explains why graph databases are the future of databases. This is excellent information aboug GSQL which is a graph query language.
Ontology + Data = Knowledge Graph
A Brief History of Knowledge Graph's Main Ideas: A Tutorial
Introduction to Knowledge the Graph
Creating a small knowlege graph video series:
Charlie
in General Information, Knowledge Graphs
|
Post a Comment
| Email
| Print

