BLOG: Digital Financial Reporting
This is a blog for information relating to digital financial reporting. This blog is basically my "lab notebook" for experimenting and learning about XBRL-based digital financial reporting. This is my brain storming platform. This is where I think out loud (i.e. publicly) about digital financial reporting. This information is for innovators and early adopters who are ushering in a new era of accounting, reporting, auditing, and analysis in a digital environment.
Much of the information contained in this blog is synthasized, summarized, condensed, better organized and articulated in my book XBRL for Dummies and in the chapters of Intelligent XBRL-based Digital Financial Reporting. If you have any questions, feel free to contact me.
Entries in Modeling Business Information Using XBRL (213)
Finally, Tool Useful to Accountants Verifying SEC XBRL Financial Filing
Finally, a tool which is useful to accountants verifying an SEC XBRL financial filing! While it isn't perfect (Version 1.0), XBRL Cloud's Evidence Package is a big, big step toward giving accountants the tools they need to effectively create and verify that they have created an appropriate SEC XBRL financial filing.
You send the URL of any XBRL instance to the Evidence Package and it returns a battery of HTML files. Here is that battery of reports for the Reference Implementation of an SEC XBRL Financial Report which I have been maintaining for several years now. (This is where you can grab the XBRL files for that reference implementation.)
I was able to convince XBRL Cloud to use the report level semantic model I gleaned from SEC XBRL financial filings and summarized in the Financial Report Semantics and Dynamics Theory. As you look at the Evidence Package, notice how you see virtually no XBRL technical syntax. The information is very readable and understandable to accountants. There are a few things you need to understand like the terms of the Financial Report Semantics and Dynamics Theory like "characteristic", "fact", and "component" and some US GAAP Taxonomy/SEC filing terms such as "Network", "Table", "Axis", "Member" and so forth, but you need to understand no such XBRL technical syntax.
If you want to understand the report level logical model articulated by the Financial Report Semantics and Dynamics Theory and determine for yourself, looking through this Evidence Package is the way to do it. And like I said, every one of the 8000 or so 10-K and 10-Q SEC XBRL financial reports fits into this model. Report level semantic errors in filings do exist and the illogical nature of the modeling is clear. For example, what does it mean to have a [Member] within a set of [Line Items]? That modeling error stands out clearly.
The narrative and videos of ten key areas of the Evidence Package helps you understand how to use the Evidence Package and helps you see how helpful it is.
(Video viewing tips: The videos seem to appear best if viewed in a Safari browser. The best size is the medium size offered by YouTube. Sorry about the quality, this is the best my tools allow.)
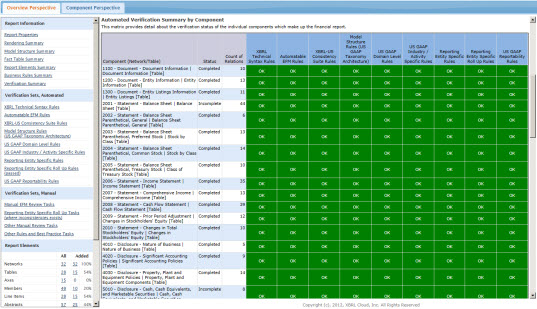
- Clarity as to your responsibility. The Evidence Package helps you see exactly what you are responsible for by summarizing both automated and manual verification tasks into an understandable dashboard and a list of each automated verification rule you must pass and manual verification task you must perform.
- Seeing all the pieces clearly. Often, just trying to read reported information can be a challenge. The SEC leaves off certain information from renderings as one example. But the Evidence Package provides 100% of all relevant information and the ability to drill down into each and every relevant property.
- Utility of component view. Rather than providing long lists thinks like validation rules, models, and other pieces which you then must refer to; the Evidence Package takes each of those very useful lists and provides them organized by component. This component view is extremely helpful in verifying that each component of your financial report is correct.
- Helpful, specifically focused reports. Special purpose, focused reports help you perform common verification tasks.
- Seeing 100% of all relevant properties. Seeing all the relevant pieces is 90 percent of the battle when it comes to making sure your SEC XBRL financial filing is correct.
- Seeing all the business rules. Automating verification tasks such as determining that mathematical computations are correct can save lots of time. But, to automate these verification tasks, you need to create the rules. Also, seeing the rules and component together is helpful in determining if in fact a necessary rule has been defined and if that rule is successfully passed.
- Quickly scanning characteristics using fact table. Fact tables are very helpful tools for scanning a component to be sure things are consistent where they should be consistent.
- Terminology understandable to accountants. XBRL technical jargon is not something that an accountant needs to understand. Software should be built to hide that ugly terminology.
- Seeing that categorizing report elements is helpful. Report elements can be categorized or grouped and those groups can be leveraged to make many things easier to understand and tasks easier to perform.
- Providing you piece of mind with a dashboard of verification status. A dashboard of green tells you that things are good to go!
Like I said, the Evidence Package is not necessarily perfect. But for a version 1.0, it is extremely helpful and a good sign for accountants trying to tame the XBRL beast. I find that this tool is very helpful in helping me understand if the digital financial reports I create are created as I desire them to be created. I was able to detect issues in my reference implementation which had gone undetected prior to using this tool.
If you want to understand the underlying model or other details, please read Digital Financial Reporting, a resource I put together to explain the report level model being used in detail.
 Charlie
in Demonstrations of Using XBRL, Digital Financial Reporting, Modeling Business Information Using XBRL
|
Charlie
in Demonstrations of Using XBRL, Digital Financial Reporting, Modeling Business Information Using XBRL
|
 Post a Comment
|
Post a Comment
|  Email
|
Email
|  Print
Print
Simple Knowledge Organization System (SKOS)
This metadata stuff keeps getting more and more interesting. A post I made to the LinkedIn group Semantic XBRLled to someone mentioning SKOS.
SKOS, or Simple Knowledge Organization System is a standard way to express metadata. A W3C recommentation, is described this way by an introduction to SKOS:
SKOS provides a standard way to represent knowledge organization systems using the Resource Description Framework (RDF). Encoding this information in RDF allows it to be passed between computer applications in an interoperable way.
Using RDF also allows knowledge organization systems to be used in distributed, decentralised metadata applications. Decentralised metadata is becoming a typical scenario, where service providers want to add value to metadata harvested from multiple sources.
Here is a SKOS primer. Here is a SKOS wiki. Here is an introduction to SKOS provided by XML.COM. Here is a SKOS reader. RDF-Gravity reader.
This is how I see it. You can express metadata using any ole XML. But, there is leverage if you not only use XML, but rather use the standard such as RDF/OWL. But even using RDF/OWL you have a lot of flexibility as to how to express things. SKOS provides an even higher level standard than RDF/OWL for the specific purpose of expressing metadata used in knowledge management systems.
So I used RDF/OWL to express the major categories, topics, disclosure objects, and disclosure templates used for some things I am trying to achieve relating to financial reporting using US GAAP. Here is that metadata.
Seems that following the SKOS standard provides an even higher level of possible interoperability. Could be wrong, but SKOS seems like the way to go, a standard form of RDF/OWL for the sort of metadata I need to model.
Charlie
in Modeling Business Information Using XBRL, XML, XBRL or RDF/OWL?
|
Post a Comment
| Email
| Print
Semantic Equivalence
The screen shot below shows a visual representation of the fact tables of two XBRL instances/XBRL taxonomies.
The top fact table representation comes from the XBRL instance/XBRL taxonomy example in the business use case "Classes" and models the components of PPE as the [Member]s of an [Axis] (using US GAAP taxonomy lingo) or dimensions of one primary item (using XBRL Dimensions lingo).
The bottom fact table representation comes from the XBRL instance/XBRL taxonomy example in the business use cases "Simple Roll Up" and models the components of PPE as concepts within a set of [Line Items] (using US GAAP taxonomy lingo) or primary items (using XBRL Dimensions lingo).
Are the two facts which express the fact value of "Land" semantically equivalent?
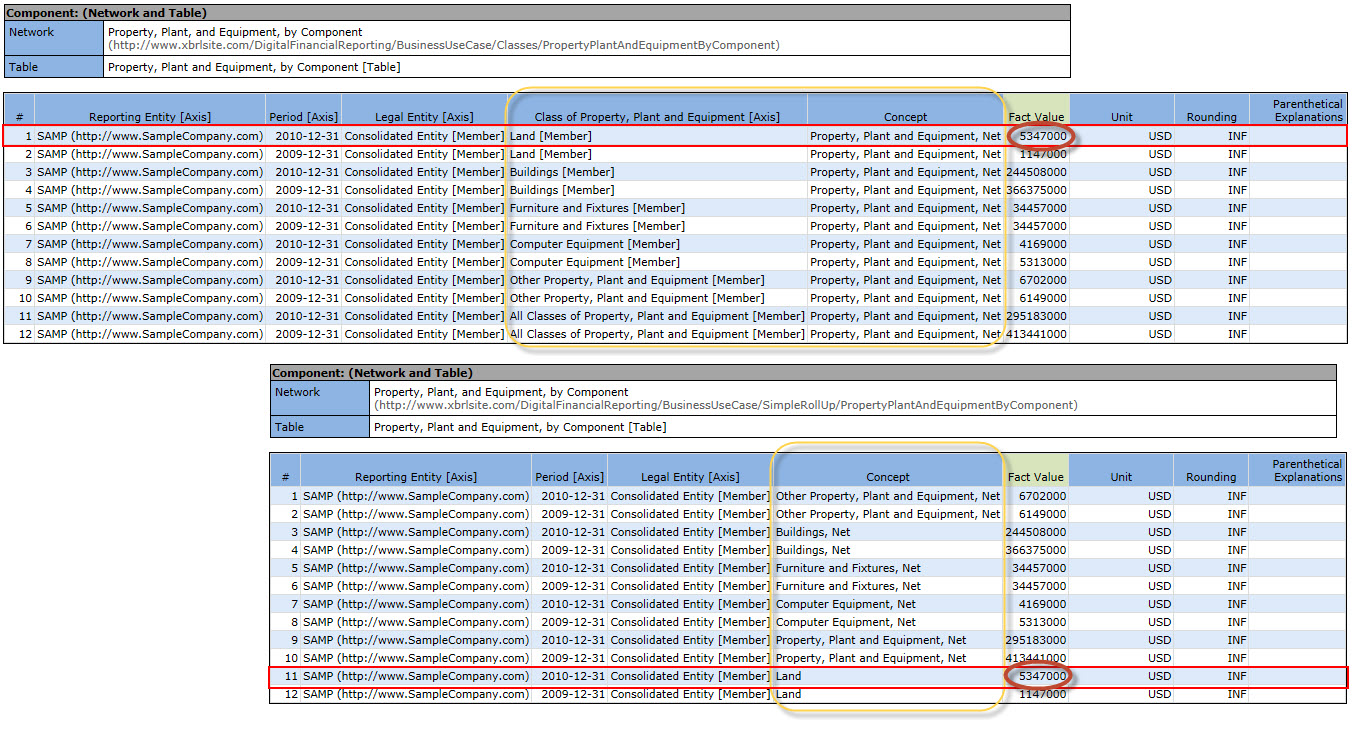
You probably answered "YES". That is the answer which I would have given. While syntactically the two facts are modeled using different approaches; semantically they say the same thing. (If you don't agree that the answer is YES, I would enjoy hearing your rational.)
So, if they are semantically equivalent; can you just take the fact in line #1 on the top fact table out and replace it with #11 from the bottom fact table? Of course you cannot because the modeling approach of the top fact table and the modeling approach of the bottom fact table are different.
Neither modeling approach is wrong. However, approaches must not be arbitrarily mixed.
Yet this is a common mistake in modeling SEC XBRL financial filings which I have seen. One of the areas where this appears the most is the modeling of classes of preferred and common stock. Mixing these approaches causes things like balance sheets which do not balance.
Something which this brings up is how do you know whichmodeling approach to use? That is a good question. Sometimes you don't really have a choice because if you are either extending an existing model or fitting another piece into some other model you need to fit your modeling into that existing model. Other times there is no clear answer. For example, in the US GAAP taxonomy sometimes both approaches are modeled and it can be confusing which to use if there are no other constraints to consider.
Charlie
in Modeling Business Information Using XBRL
|
Post a Comment
| Email
| Print
Ontology is Overrated: Categories, Links, and Tags
Cliff Shirky's article, Ontology is Overrated: Categories, Links, and Tags, takes a look at organization schemes and points out why past organization practices might not be appropriate in our increasingly digital world.
Charlie
in Modeling Business Information Using XBRL, ontology
|
Post a Comment
| Email
| Print
Another Comparison Tool for SEC XBRL Financial Filings, by Industry
Yesterday I posted information about a prototype comparison tool I created.
Here is another one. This comparison tool lets you select a financial report component and then an industry group. This limits your comparison to a specific industry.
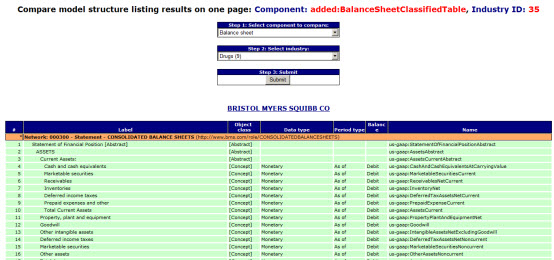
Pretty straight forward stuff, if one can figure out which components of each company which you want to compare.
Here is why this is someone challenging. In order to compare a component, you need to identify the component you wish to compare. No problem, every SEC 10-K and 10-Q filing has a balance sheet. But, every SEC filer identifies the balance sheet differently. Here is a list of the balance sheet identifiers for this set of 291 SEC filings I am working with: Balance sheets.
All different. Same for the income statement, cash flow statement, document information, significant accounting policies.
So, why is it the case that the SEC or FASB or someone could not say "To identify the balance sheet, use the network identifier 'http://fasb.org/financialReportComponents/BalanceSheet'? Well, they could have. Or, even better in my view, if everyone creating a balance sheet used the table "us-gaap:BalanceSheetTable". That would work also. In fact, that is sort of another problem, what identifies the component, the network or the [Table].
Very, very frustrating for anyone trying to use the information. Now, you CAN figure this out. If you read the section of the Digital Financial Reporting resource related to analysis, which you can get here, and check out the section on prototype theory; you will see that it is still possible to identify things; but it is still harder than it really needs to be if you ask me.
Perhaps there is some reason why every filer creating their own unique identifier for every single component expressed in a financial report is better. If you know the reason why, please let me know.
Charlie
in Modeling Business Information Using XBRL
|
Post a Comment
| Email
| Print

