BLOG: Digital Financial Reporting
This is a blog for information relating to digital financial reporting. This blog is basically my "lab notebook" for experimenting and learning about XBRL-based digital financial reporting. This is my brain storming platform. This is where I think out loud (i.e. publicly) about digital financial reporting. This information is for innovators and early adopters who are ushering in a new era of accounting, reporting, auditing, and analysis in a digital environment.
Much of the information contained in this blog is synthasized, summarized, condensed, better organized and articulated in my book XBRL for Dummies and in the chapters of Intelligent XBRL-based Digital Financial Reporting. If you have any questions, feel free to contact me.
Entries from December 1, 2020 - December 31, 2020
Proof Baseline
This PROOF BASELINE is an excellent learning tool. For even more information please see this blog post. The PROOF BASELINE is about getting the logic right. Once you have the logic right, all you need is control. Control is achieved through the use of rules. (This is the most current iteration of the proof baseline.)
- Technical syntax: Checks to be sure the XBRL technical syntax is appropriate.
- Model structure: Checks to see that XBRL presentation relations between report element categories are permitted.
- Roll up math: Checks to see if fundamental roll up relations expressed as XBRL calculation relations are valid.
- Roll forward and other math: Checks to see if all other mathematical relations expressed as XBRL formulas are valid.
- Type-subtype relations: Checks to see that "general-special" and/or "type-subtype" and/or "wider-narrower" relations are as expected.
- Disclosure mechanics: Checks essential report elements and related facts to see if disclosures are represented as permitted.
- Disclosure rules (reporting checklist): Checks disclosures to be sure required disclosures have in fact been effectively disclosed.
This best practice method can be used to verify that a financial report is a properly functioning system. There is still manual work necessary.
If you learn to create that PROOF BASELINE, you can very likely create any XBRL-based financial report. To understand that representation, please read Intermediate XBRL-based Digital Financial Reporting. (Specifically, the documentation.) I will resync the documentation to the newest version of that PROOF BASELINE eventually.
You should consider trying to create what you can using Luca or my free open source tool.
The most challenging approach is to use the Inline XBRL or the PDF as your starting point to create the report. Alternatively, start by creating the model and the rules; then create the XBRL instance.
 Charlie
in Digital Financial Reporting
|
Charlie
in Digital Financial Reporting
|
 Post a Comment
|
Post a Comment
|  Email
|
Email
|  Print
Print
Representing Information Logically
There is a difference between signal and noise. Compare these three representations of one fragment of a financial report, the financial highlights:
- Represented with a hypercube but no dimensions | (Get to full report)
- Represented with a hypercube and four dimensions | (Get to full report)
- Represented with a hypercube and twelve dimensions | (Get to full report)
Think about something. Logically, what exactly is the difference between the representations with 0, 4, and 12 dimensions?
The first representation is thrown in to round out the set of examples. I could have shown another representation with NO HYPERCUBE. So what exactly is the difference between a representation with NO hypercube and no dimensions and with 1 hypercube and no dimensions? What logic does the hypercube provide? The answer is that the hypercube only provides something to reference so that you can get to the representation itself which is identified by the hypercube.
The second representation was verified to be correct mathematically using XBRL Formulas. If you look at the validation result you can see there are 46 assertions which were used 96 times to verify information and that 100% of the results are "satisfied" meaning everything checks out fine.
The third representation is exactly the same as the second except for the fact that I added those additional dimensions to the financial highlights and to the balance sheet. See the presentation relations and the definition relations. I then ran exactly the same verification rules to check and see if the math was still correct using XBRL Formula. If you look at those results you notice that there are still 46 assertions, 96 were fired, and 96 were satisfied.
What is my point? Logically, the XBRL Formula processor sees both the second and third representations as being logically the same. Proof of this is the second and third representation validation results being 100% identical.
Why is this important? Read through the list of XBRL dimensions in the second and third representations. How helpful to you are the additional 8 in understanding the reported information? The first four provide explicit and helpful information: what is the reporting entity, what is the legal entity, what is the report date, and what is the reporting scenario. You can get away without the report date and the reporting scenario; those can be safely implied. Maybe even the consolidated entity could be implied.
But customer, debt instrument, segment, director, related party, share ownership plan, reconciling item? Those are details that are used on some other hypercube but are not relevant to the financial highlights or balance sheet. Basically, those additional 8 dimensions are noise rather than signal.
Dimensions in XBRL work a certain specific way. That way is specified. Each regulator or other party implementing XBRL does not get to reinvent what dimensions are, what they do, or how they work. All that is specified.
My little proof shows that most of this stuff works consistently across regulators that have implemented XBRL; a few things don't quite work correctly.
For more information please see my document Representing Structures.
Charlie
in Digital Financial Reporting
|
Post a Comment
| Email
| Print
Financial Reporting Schemes in XBRL
In the document the Essence of Accounting I point out the mathematical model of double entry accounting and the accounting equation. I pointed out that there are a number of financial reporting schemes and that every financial reporting scheme, by definition, follows the double entry accounting model and some form of the accounting equation.
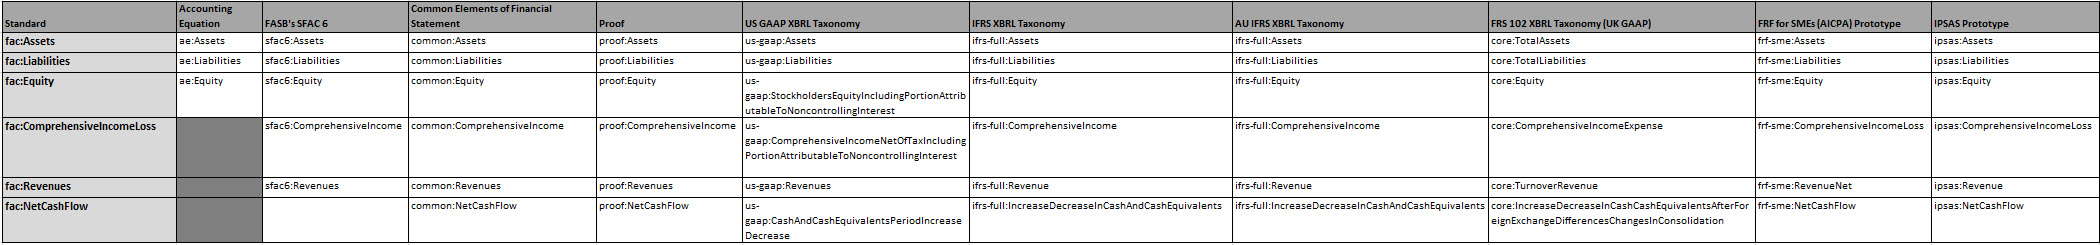
I also pointed out that each financial reporting scheme defines some set of high-level financial report elements that make up the foundation or "key stones" of the financial reporting scheme. This is usually done in the conceptual framework of the financial reporting scheme. For example, the FASB defines the ten terms that form the foundation of US GAAP in SFAC 6 Elements of Financial Statements: Assets, Liabilities, Equity, Comprehensive Income, Investments by Owners, Distributions to Owners, Revenues, Expenses, Gains, Losses.
This is the same for:
So, you can expand the patterns down a little lower which I have summarised in my baseline PROOF representation and compared my PROOF representation to US GAAP and IFRS (working on FRS 102 now which will be forth coming).
And so while such financial reporting schemes are described inconsistently for a number of reasons, the essence of what all of these financial reporting schemes is saying, or should be saying, is very consistent. While the definitions of the terms are not necessarily consistent, the mechanical aspects are very, very consistent. What I mean is that US GAAP, IFRS, and UK GAAP define "Assets", "Liabilities" and "Equity" differently; each of the financial reporting schemes does define Assets, Liabilities, and Equity and it is always the case that the rule "Assets = Liabilities + Equity" in some form.
This is the true for a high-level set of about 100 or so terms, associations between terms, structures, and rules which are consistently defined or implied by US GAAP, IFRS, UK GAAP (FRS 102). I will compile that list. Here is a prototype of that list:
- Fundamental Accounting Concepts Associations: Human readable | Machine readable
- Fundamental Accounting Concepts Roll Up Relations: Human readable | Machine readable
- Fundamental Accounting Concepts: Machine readable
I suggest that this is also true for IPSAS, FRF for SMEs, Canadian GAAP, Australian GAAP, and many other (any other) financial reporting schemes. Why would you go through all this trouble. Have a look at this:
Machine readable:
Don't understand? The ZIP archive below contains an Excel spreadsheet for extracting information from the XBRL file above. Run that and have a look at the code. The code is pretty simplistic, but the point is you can grab information from the XBRL file.
Still don't understand? You are going to want to read Computational Professional Services. Have a look at this financial reporting metadata. This is not going to work by magic. Start at the top, work your way down; each financial reporting scheme pretty much works the same way.
This is a huge opportunity for software engineers that understand how to communicate with accountants and accountants that understand how to communicate with software engineers.
Piece by piece, the metadata that will drive the next era of accounting, reporting, auditing, and analysis will be put together. Here is some US GAAP and IFRS financial reports to fiddle with. HMRC does not make information available, ESMA is not up and running yet. This is not about reporting to the SEC, this is about understanding the sorts of things you can do with reports because the information is structured, complements of 10 years of XBRL-based reports submitted to the SEC.
Will XBRL be the format used? Maybe, maybe not.
Charlie
in Digital Financial Reporting
|
Post a Comment
| Email
| Print
FRS 105 Micro Entities
The United Kingdom has an interesting financial reporting scheme called FRS 105, The Financial Reporting Standard applicable to the Micro-Entities Regime. That financial reporting scheme uses the FRS 102 XBRL Taxonomy (here is an easy to read version). Here is the actual XBRL terms: core | bus.
The UK is not modularizing the XBRL taxonomies in a manner similar to the IFRS or US GAAP XBRL Taxonomy. They combined things together than you cannot undo, which is unfortunate.
Charlie
in Digital Financial Reporting
|
Post a Comment
| Email
| Print
Building an Expert System
This video from Grakn Labs, Building a Digital Tax Accountant with a Knowledge Graph Mind, walks you through how to build a tax expert system (in this case Taxfix).
These same ideas can be used to create an accounting and financial reporting oriented expert system for US GAAP and/or IFRS or any other financial reporting scheme.
You might find it useful to check out these three articles:
Clearly a tax reporting system, an accounting related expert system, a financial reporting related expert system, an audit related expert system, or an analysis related expert system would work differently and have different work flows; but fundamentally, these are all the same sorts of things.
Here is how a software engineer and I built a working prototype expert system for creating XBRL-based financial reports and verifying that the reports were properly functioning. This video play list shows what we created. You can download it and try it out (email me and I will send you a license good for a year).
Charlie
in Digital Financial Reporting
|
Post a Comment
| Email
| Print

