BLOG: Digital Financial Reporting
This is a blog for information relating to digital financial reporting. This blog is basically my "lab notebook" for experimenting and learning about XBRL-based digital financial reporting. This is my brain storming platform. This is where I think out loud (i.e. publicly) about digital financial reporting. This information is for innovators and early adopters who are ushering in a new era of accounting, reporting, auditing, and analysis in a digital environment.
Much of the information contained in this blog is synthasized, summarized, condensed, better organized and articulated in my book XBRL for Dummies and in the chapters of Intelligent XBRL-based Digital Financial Reporting. If you have any questions, feel free to contact me.
Entries from December 1, 2020 - December 31, 2020
Data and AI are the Future; Graph is the Future of the Future
As The Year of the Graph puts it: Data and AI are the future; graph is the future of the future. Structured data, artificial intelligence, graph databases all have implications for accounting, reporting, auditing, and analysis. If you don't understand the details of what a knowledge graph is, this Knowledge Graphs at a Glance is helpful.
It is time for professional accouontants to expand their knowledge.
Start here: Computational Professional Services.
 Charlie
in Digital Financial Reporting
|
Charlie
in Digital Financial Reporting
|
 Post a Comment
|
Post a Comment
|  Email
|
Email
|  Print
Print
Mechanism for Understanding XBRL-based Financial Report Semantics
I have put together a mechanism for understanding, testing, and even agreeing on the meaning conveyed by an XBRL-based financial report and the underlying XBRL taxonomy for any financial reporting scheme. What I have done is take what I call my PROOF representation which I am calling a baseline representation and then represented that same meaning using the US GAAP XBRL Taxonomy information, the IFRS XBRL Taxonomy information, UK GAAP (FRS 102) XBRL Taxonomy, and Australian IFRS XBRL Taxonomy. Here are all representations: (to learn how to interpret these, please see this tutorial)
- PROOF BASELINE using my XBRL Taxonomy (Updated 2020-12-30)
- PROOF information represented using US GAAP XBRL Taxonomy (2019)
- PROOF information represented using IFRS XBRL Taxonomy (2020)
- PROOF information represented using UK GAAP (FRS 102) Taxonomy (2019) (work in progress)
- PROOF information represented using Australian (AU) IFRS XBRL Taxonomy (2020)
My focus is primarily on the mathematical connections between the different structures of a report. You can understand these relations if you are not an accountant via this graphic: (click the image for a larger view)
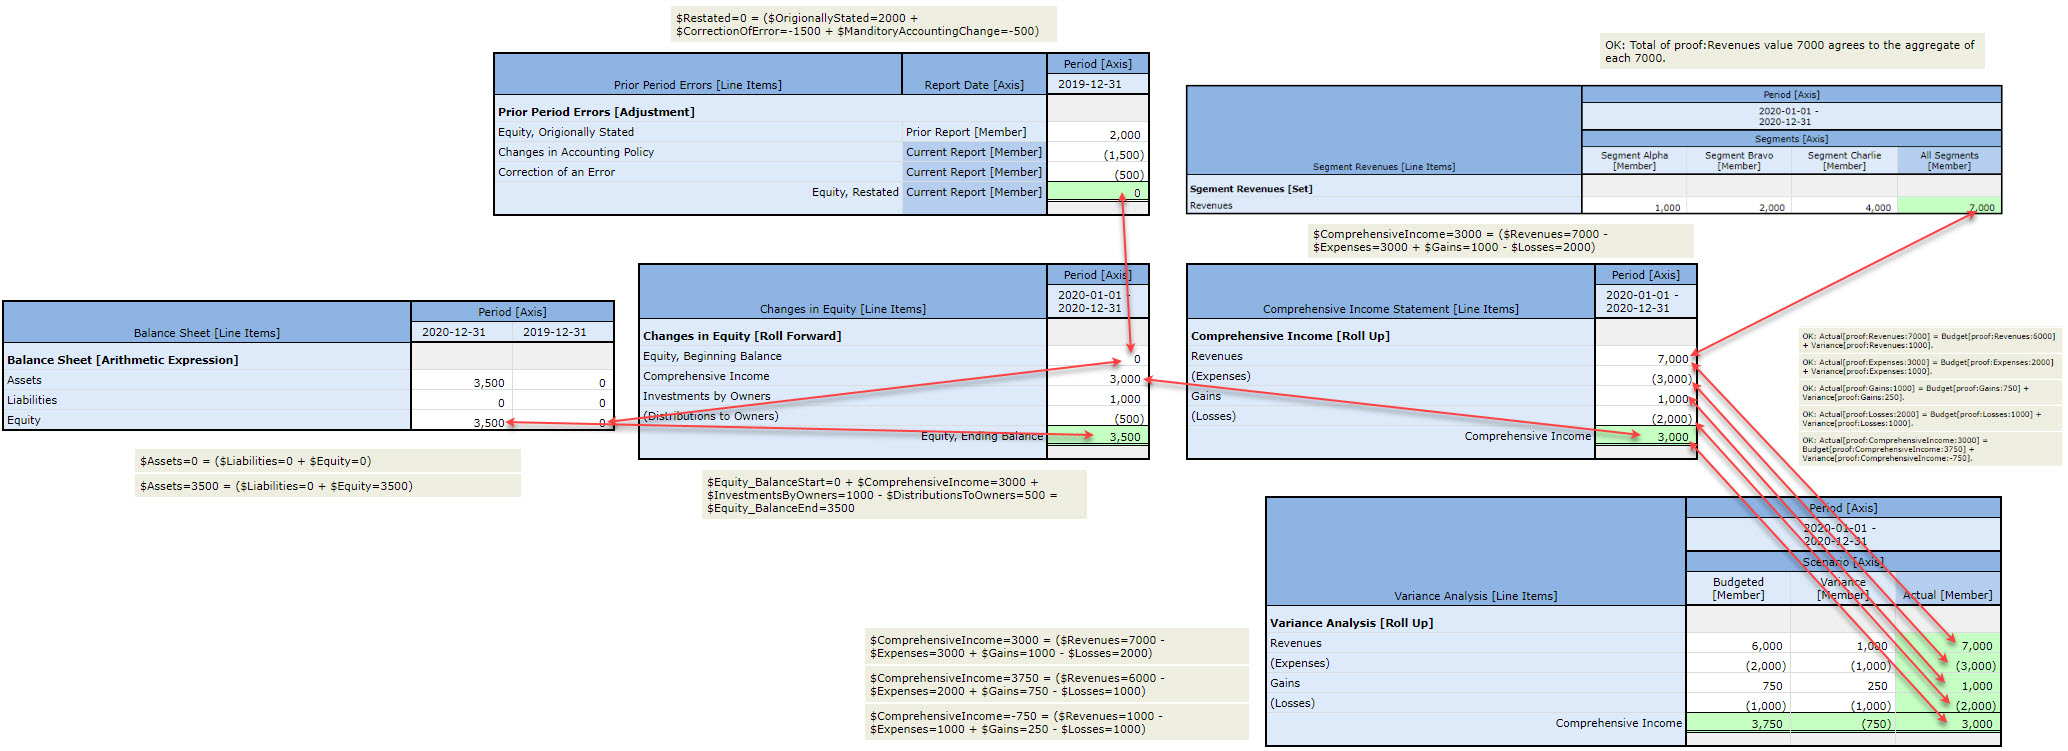
Understanding and expressing these mathematical needs to be provided for in XBRL-based taxonomies for financial reporting and not a guessing game that accountants must individually figure out. What I have works. There could be other ways to achieve everything I am achieving. You really cannot deny the use cases! All this will be represented in machine-readable form including the terms and rules (those are prototypes for US GAAP). This is what I have this far.
Roll ups tend to be pretty well understood by those creating XBRL-based financial reports. Roll forwards are probably well understood, but their are some idiosyncrasies people tend to miss. Member aggregations are less well understood. Adjustments which reconcile an originally stated balance to a restated balance seem to be misunderstood. Variance which reconciles an actual balance to a budget or forecast (i.e. a different reporting scenario). Effectively these are all sets of information that have some logical and mathematical relationship(s) within the set. There are a few other information patterns that exist in XBRL-based reports but tend to be less problematic.
All of these information patterns are explained in this document, Concept Arrangement Patterns, and this document, Member Arrangement Patterns.
More information coming with regard to this comparison/contrast of US GAAP and IFRS taxonomies and reconciling them to required financial reporting semantics.
#####################
Charlie
in Digital Financial Reporting
|
Post a Comment
| Email
| Print
OntoCommons
OntoCommons is a new Europenan ontology-driven project for a common understanding across industrial domains. OntoCommons is described as:
"OntoCommons provides a reliable turnkey solution for industrial stakeholders to confidently use ontologies in their businesses and to share their data. In addition, OntoCommons will prove the long-awaited key role of ontology in ensuring data interoperability and will promote data-driven innovation by boosting trust in the semantics of the shared industrial data."
Hedi Karray – OntoCommons Technical Coordinator
Charlie
in Digital Financial Reporting
|
Post a Comment
| Email
| Print
Intermediate XBRL-based Financial Reporting
If you are here and you have not been through my gentle and cheap introduction to XBRL-based digital financial reporting, you might want to start there and then return here.
This intermediate XBRL-based digital financial reporting builds on what you learned in the introduction. There are two parts to this intermediate tutorial:
There are two primary areas of focus on this intermediate discussion of XBRL-based digital financial reporting. First, we want to disect the PROOF representation. Second, we want to compare/contrast different financial reporting schemes; building up from small to large so that you can see the fundamental pieces of XBRL-based digital financial reports.
Whether you have already watched to video playlist Understanding the Financial Report Logical System, now would be a good time to watch that playlist again.
You can use this Microsoft Access-based XBRL-based report creation tool which focuses on what you need at the moment.
Charlie
in Digital Financial Reporting
|
Post a Comment
| Email
| Print
Free Open Source Tool for Creating Quality XBRL-based Digital Financial Reports
I have created and provided for free and open source (i.e. Creative Commons Public Domain Dedication) a software tool for creating XBRL taxonomies, XBRL linkbases including XBRL Formula, and XBRL instances including RAW XBRL and Inline XBRL. The software application was created using Microsoft Access and can be downloaded here.
You can understand what the tool does and learn how to use it from the gentle introduction to creating XBRL-based financial reports.
To give you an idea of the tool's capabilities, it was used to create this Inline XBRL based financial report example that I use for testing. Here are all the files assocationed with that Proof PLUS example.
The biggest limitation is the GUI which is not that fancy yet because of my limited programming skills, but I hope to get that rectified soon.
Any software engineer that might be interested in converting this into Python, Microsoft.Net, or some other language of your choice please don't hesitate to contact me and I can help you make that happen.
Charlie
in Digital Financial Reporting
|
Post a Comment
|
 2 References
| Email
| Print
2 References
| Email
| Print

