BLOG: Digital Financial Reporting
This is a blog for information relating to digital financial reporting. This blog is basically my "lab notebook" for experimenting and learning about XBRL-based digital financial reporting. This is my brain storming platform. This is where I think out loud (i.e. publicly) about digital financial reporting. This information is for innovators and early adopters who are ushering in a new era of accounting, reporting, auditing, and analysis in a digital environment.
Much of the information contained in this blog is synthasized, summarized, condensed, better organized and articulated in my book XBRL for Dummies and in the chapters of Intelligent XBRL-based Digital Financial Reporting. If you have any questions, feel free to contact me.
Entries from January 1, 2019 - January 31, 2019
Understanding the Utility of a Logical Theory
A theory is a formal statement of rules about some subject that describes and otherwise explains the nature of that subject.
A theory describes some aspect of the world and tries to describe the principles by which that aspect of the world operates. A theory can be right or wrong, but a theory is characterized by its intent: the discovery of essence. A theory does not simplify. A theory describes absolutes. A successful theory can become a fact. A theory is a tool for contemplating something with an intent to gain insight or understanding.
Logic a set of principles that form a framework for correct reasoning. Logic is a process of deducing information correctly. Logic is about the correct methods that can be used to prove a statement is true or false. Logic tells us exactly what is meant. Logic allows systems to be proven.
Logic is the process of deducing information correctly; logic is not about deducing correct information. Understanding the distinction between correct logic and correct information is important because it is important to follow the consequences of an incorrect assumption. Ideally, we want both our logic to be correct and the facts we are applying the logic to, to be correct. But the point here is that correct logic and correct information are two different things. If our logic is correct, then anything we deduce from such information will also be correct.
In logic, a statement is a sentence that is either true or false. You can think of statements as pieces of information that are either correct or incorrect. And therefore, statements are pieces of information that you apply logic to in order to derive other pieces of information which are also statements.
A logical theory is a set of logical statements that formally describes some subject or system. Axioms are statements that describe self-evident logical principles that no one would argue with. Theorems are logical deductions which can be proven by constructing a chain of reasoning by applying axioms and the rules of logic in the form of IF…THEN statements.
A rule, or business rule or assertion, is a true statement with respect to some model of the real world that could possibly exist given some logical theory. You cannot create rules that are true in worlds that can never exist. A rule can be a mathematical expression. A rule is a type of logical statement.
The Financial Report Semantics and Dynamics Theory is a logical theory that explains how the mechanical aspects of a financial report work. The Method of Implementing a Standard Digital Financial Report Using the XBRL Syntax is an approach to creating XBRL-based reports consistent with the Financial Report Semantics and Dynamics Theory.
There are many different approaches to describing logical systems: taxonomies, ontologies, UML, conceptual models, or logical theory. But logical theories are the easiest form of describing systems that is approachable by business professionals.
 Charlie
in Digital Financial Reporting
|
Charlie
in Digital Financial Reporting
|
 Post a Comment
|
Post a Comment
|  Email
|
Email
|  Print
Print
Populous is Ready to Disrupt the Multi-trillion Dollar Discounting Industry Using XBRL
Populous is ready to disrupt the multi-trillion dollar discounting industry using XBRL. They provide a lot of information on their web site, including this.
Charlie
in General Information
|
Post a Comment
| Email
| Print
Public Exposure for CAFR Taxonomy
The group creating the CAFR Taxonomy for financial reporting by state and local governmental entities has released a public exposure demonstration CAFR Taxonomy.
This is the main entry point into the CAFR Taxonomy.
In addition, there were nine Inline XBRL documents that have been created using that taxonomy; here are the Inline XBRL documents, the governmental entity the financial information is for, and who created the document:
- County of Albemarle, VA (EZ-XBRL)
- Ashland, VA (EZ-XBRL)
- Alexandria, VA (Sole practitioner)
- Bristol, VA (EZ-XBRL)
- Falls Church, VA (Sole practitioner)
- State of Georga (Workiva)
- Loudon County, VA (Sole practitioner)
- St. Petersburg, FL (Thales Consulting)
- Virginia Beach, VA (Thales Consulting)
- State of Utah (Workiva)
- County of Culpeper, VA (EZ-XBRL)
- County of Fauquier, VA (EZ-XBRL)
- Hillsborough County District School Board, (IRIS Business)
- Jacksonville Aviation Authority, FL (IRIS Business)
- County of McHenry, IL (DataTracks)
So, they look pretty. But how good are they?
I took the URLs for all of these financials, put them into TWO RSS feeds that are machine readable:
- Look at files using an Inline XBRL Viewer.
- Machine readable, direct to Inline XBRL document.
I ran the 9 document through XBRL Cloud validation and this is what I got. Hard to tell exactly what is going on; of the 9 only three were even validationed:
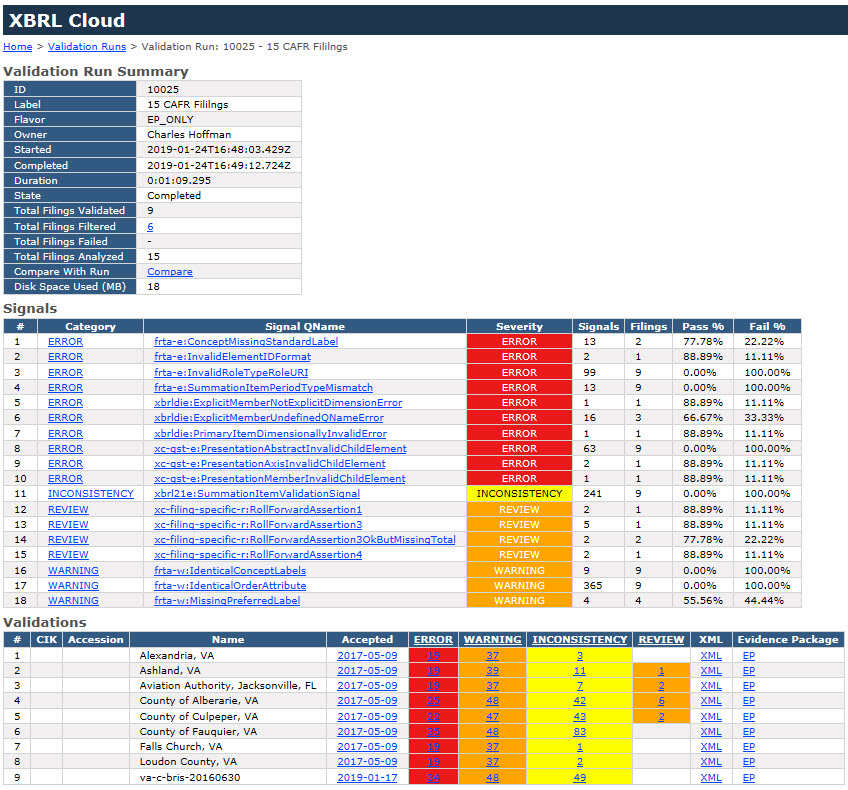 (Click image for larger view)
These look very nice, the creators get an A+ for presenting the information nicely. I also give the files an A+ for XHTML syntax, all are 100% valid XHTML. There seem to be a lot of XHTML formatting issues like attributes on elements that are not allowed.
But I give these XBRL-based financials a D- for machine-readability. Plenty of room for improvement.
Charlie
in Becoming an XBRL Master Craftsman
|
Post a Comment
| Email
| Print
International Public Sector Accounting Standards XBRL Taxonomy Prototype Project
I an undertaking a project. That project is to create a high-quality, best practices example of a "base taxonomy" including all documentation, an extension taxonomy that uses that base taxonomy, and a set of XBRL instances that proves that the base taxonomy and extension taxonomy work effectively all of this using the Method of Implementing a Standard Digital Financial Report Using the XBRL Syntax.
This project is being undertaken for the following reasons:
- To provide the next level of detail for the method.
- To help a handful of people understand the method intimately.
- To tune details in software I have created which supports this method.
- To provide enough of an example to prove certain aspects of this method.
I am going to summarize information on this blog page. Here are the actual details that relate to creating this taxonomy/ontology. Bookmark this page if you want to follow along.
STEP 1 - Initial Inventory of Topics
International Public Sector Accounting Standards are published by the IPSASB. The Conceptual Framework for General Purpose Financial Reporting by Public Sector Entities provides the big picture.
Fundamentally, IPSAS is used for financial reporting by governments and other public sector entities. This includes: government ministries, departments, programs, boards, commissions, agencies; public sector social security funds, trusts, and statutory authorities; and international governmental organizations.
The first step in creating an XBRL Taxonomy for a reporting scheme is to create an initial inventory of the topics to be covered by the taxonomy. To get this intitial inventory you can use the conceptual framework, IPSAS 1 - Presentation of Financial Statements, and information from the 2018 Handbook of International Public Sector Accounting Standards Pronouncements.
Again, this is just an initial list of topics not the complete list of topics. Here is the list of topics that I came up with:
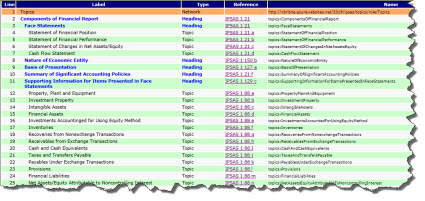 (Click image for list of topics)
I represent the ist of topics in XBRL. You can see the XBRL taxonomy schema and the linkbases on the page above. You can also download the entire topics XBRL taxonomy.
Getting a lost of topics is not necessarily required in the creation of an XBRL taxonomy, but (a) it is very helpful in organizing the disclosures that can number in the thousands potentially and (b) the topics are extremely helpful to software applications that are providing information about disclosures to software users.
STEP 2 - Initial Inventory of Disclosures
The next step is to use the same materials you used for creating the initial list of topics to create the initial list of disclosures.
Here is the initial list of disclosures that I came up with:
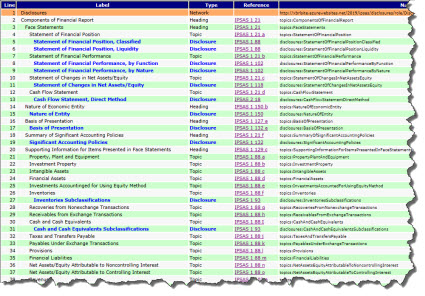 (Click image to view list of disclosures)
Note that the disclosures are represented in the list above along with the topics. The topics are simply used to organized the disclosures. Note that the topics and headings are shown in a normal font, the disclosures are shown in blue. Again, I represented the list of disclosures in XBRL. And, you can download the XBRL taxonomy from the page shown above.
Additional disclosures will be represented using disclosure checklists (here is an example), illustrative financial statements, examples from financial reports (like this UNESCO report), etc.
STEP 3 - Decide on Report Element Category Terms and Allowed Model Structure Relations
The next step is to decide on the terms you will use to refer to the categories of report elements. If you don't understand what "report element" or "model structure" means, please see page 31 of the method document. Here are the terms and relations that I have decided to use:
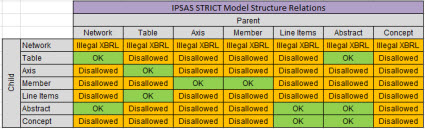 (Click impage to go to larger view)
Again, the model structure relations are represented using an XBRL linkbase. This means that a software application can be dynamically set using machine-readable rules. Also, the rules can be changed by simply changing the XBRL linkbase rather than having a programmer change the software application.
The alternative terms that are generally used are shown below with the term that I used in BOLD. I am basically going with the same term used by the US GAAP and IFRS XBRL taxonomies as you can see from this comparison of XBRL impementation profiles (see page 3).
- Network | Group | Base Set
- Hypercube | Table
- Dimension | Axis
- Member
- Primary Items | Line Items
- Abstract
- Concept
In terms of the relations, I will discuss this later when I start creating the taxonomy. Basically, the model structure relations provide a guide as to how to create your XBRL presentation relations consistently. Here are the allowed and unallowed relations documented in machine readable form (model structure relations).
STEP 4 - Start to Document the XBRL Taxonomy Architecture
Here is a document that explains the architecture of the IPSAS XBRL Taxonomy. Note that this document and the architecture of this XBRL taxonomy is a work in progress. The document will be updated as the taxonomy is created and as XBRL instances are created to test the taxonomy.
In terms of the taxonomy architecture, there are two key things to understand:
- The IPSAS taxonomy will consciously leverage the best ideas and best practices of other financial reporting type taxonomies. A best practice is a method or technique that has been generally accepted as superior to any alternatives because it produces results that are superior to those achieved by other means or because it has become a standard way of doing things.
- The IPSAS taxonomy will (a) conscously implement XBRL dimensions as they are suggested that they be implemented by XBRL Internationaland (b) in such a way as to maximize the ability to easily and successfully extract information from XBRL instances created using this taxonomy.
So, in a nutshell, that will help you understand the high level details of the taxonomy's architecture. Decisions are made based on engineering design principles which includes testing, not personal opinion or speculation.
STEP 5 - Initial Draft of Taxonomy with "Keystones"
Here is an initial draft of the XBRL taxonomy and a supporting XBRL instance. You can download the entire draft here. Here ia a HUMAN READABLE versionof the initial test XBRL instance.
The goal is to create something that is as basic as possible that communicates the idea of "getting the XBRL taxonomy under control and KEEPING it under control. This is a quality control measure. The idea is to test all the pieces of the XBRL taxonomy and the interaction between the pieces by creating an XBRL instance and all of the business rules for the taxonomy as the taxonomy is being created. This is an idea from agile software development.
The "keystones" are the high-level relationships, the "business rules", of the information the XBRL taxonomy is representing. This is not all the relations as not all the allowed variability has been added to the taxonomy. What I mean by that is that I have one balance sheet in this version, my second version already has THREE balance sheets.
Also, ignore the modularity of the taxonomy, ignore lots of things. Focus on the notion of getting the XBRL taxonomy under control and KEEPING it under control for the remainder of the creation process.
STEP 6 - Initial Draft of Target Disclosures
A general purpose financial report is organized around the balance sheet. My initial target for representing disclosures is the four primary financial statements (balance sheet, income statement, statement of changes in equity, cash flow statement) and a number of disclosures that provide DETAILS of information on the primary financial statements.
So, just like in STEP 5 above, everything is "tied together" and the integrity of EACH disclosure is sound and the interaction BETWEEN all of those disclosures is sound.
This set of disclosures is my target. I want (a) all those taxonomy pieces created and (b) the business rules that DESCRIBE how reports should be created and can be used by automated processes to VALIDATE that they have been created CORRECTLY, and (d) an XBRL instance that contains all of those disclosures which exercises the rules to MAKE SURE everything is working as expected.
STEP 7 - Build First Disclosure (Fragment), Repeat until all Disclosures are Created
Now you create the first fragment of your XBRL Taxonomy, test it to make sure it is 100% correct per the rules, and make sure the new fragment is not inconsistent with any other taxonomy fragments. Then, you REPEAT this process until all fragments of the taxonomy (all Disclosures) have been completed.
Here are the steps that you go through for each taxonomy fragment.
Again, you build the XBRL taxonomy, all the rules, and an XBRL instance to TEST the taxonomy and rules. If everything works, you go to the next taxonomy fragment.
STEP 8 - Repeat Building for 15 Core Disclosures
Now I have taken the basic steps of this method and repeated them for the first 15 disclosures in the IPSAS XBRL Taxonomy. That gives me the following:
- XBRL instance that is used to test all of the first 15 disclosures.
- Human readable version of XBRL instance with initial validation information. (You can download this here.)
- This document explains the core mathematical relationships. (This document helps you understand the differences between the types of mathematical relations.)
- Initial list of reporting styles and related rules.
- Disclosure mechanics rules | Disclosure Mechanics + Reporting Checklist Rules XBRL Cloud
- Reporting checklist rules
- XBRL Calculations (i.e. roll ups) validation results
- XBRL Formula validation results
This ZIP archivehas a version of the CORE of the IPSAS Taxonomy that you can download.
This graphic below shows my objective. In short, each fragment or "subassembly" of the report and XBRL taxonomy is correct per each category of validation in the method I am using and the complete "assembly", the full report, is likewise completely valid:
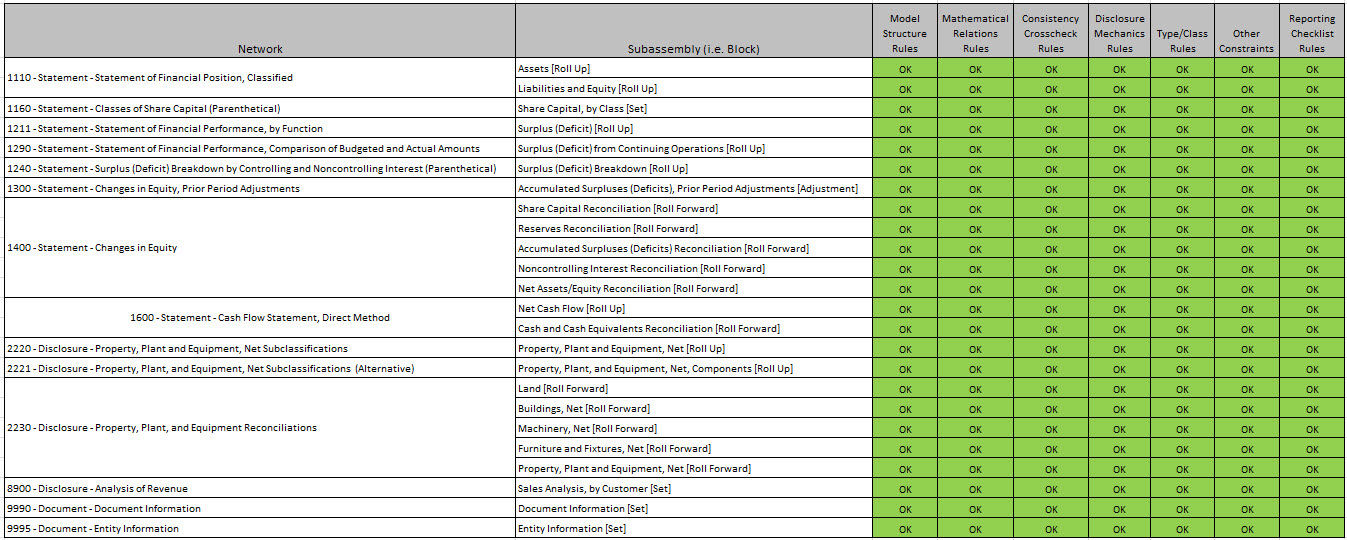 (Click image for larger view)
I cannot do this yet as the IPSAS XBRL Taxonomy (Prototype) is not supported by the software that I am using. That should take a couple of days to support that IPSAS profile. At the same time we are implementing the ability to dynamically validate all of the rules used in this method by simply attaching the XBRL taxonomy schemas and linkbases directly to the XBRL instance. This is achieved by simply following an open source framework that I developed specifically for this purpose.
So currently all of this works as expected within three software tools that I use to verify that everything works. But I cannot be sure the disclosure mechanics, consistency checks, and reporting checklist are working until I can actually run those tests.
This is where I am now in the process: (not that this has remnants that will ultimately be deleted or renamed)
- IPSAS XBRL Taxonomy entry point: Human readable | Machine readable
- IPSAS Topics: Human readable | Machine readable
- IPSAS Disclosures: Human readable | Machine readable
- IPSAS Reporting styles: Human readable | Machine readable
- IPSAS Consistency rules: Human readable | Machine readable
- IPSAS Impute rules: Human readable | Machine readable
- IPSAS Disclosure mechanics rules: Human readable | Machine readable
- IPSAS Reporting checklist rules: Human readable | Machine readable
- IPSAS Class relations: Human readable | Machine readable
- IPSAS Properties: Human readable | Machine readable
- IPSAS Disallowed class/type relations rules: Human readable | Machine readable (Work in progress)
- IPSAS XBRL instance used to prove taxonomy: Human readable | Machine readable
Presuming you have created an XBRL taxonomy correctly and finding that you have created an XBRL taxonomy correctly are two very, very different procedures. One procedure is based on knowledge; you PROVE to yourself that the XBRL taxonomy has been created correctly because you can observe that it works as anticipated. The other procedure is based on ignorance; don't bother to test, just cross your fingers and hope for the best.
STEP 9 - Repository
To test the interaction of reports, I created a mini repository of IPASA reports. Currently, the reports are the same except for the entity identifer and the economic entity name. That allows for a first layer of testing. The reports will be changed more to enable additional testing.
STEP 10 - Templates and Exemplars
A "template" is simply an example of some disclosure that can be imported directly into a financial report, making creating the report easier. An "exemplar" is also an example of some disclosure that might exist within a financial report, but this comes from some existing report. Basically, both templates and exemplars are helpful examples. Information about templates and exemplars is provided using XBRL references syntax.
STEP 11 - Formal Class Relations and Properties
Formally define class relations and properties of taxonomy concepts.
RESULT
Here is the final result of what you get which is a literal web of machine-readable information that software can leverage to provide functionality to software users PLUS high-quality, high-resolution financial reports:
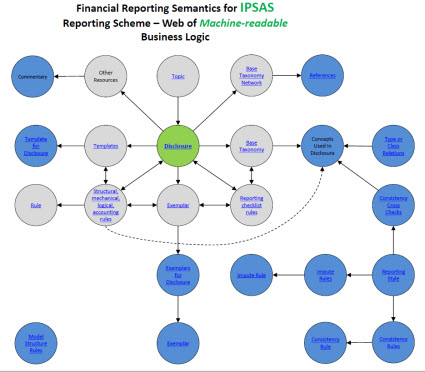
(Click image for larger view)
Seems like a lot of work. Yes it is. But that is how you derive the benefits of XBRL-based digital financial reporting. The same method is used for US GAAP, IFRS, XASB (a prototype reporting scheme I created for testing), or any other reporting scheme. To better understand the machine-readable information, here is HUMAN READABLE Information that is helpful in understanding the machine-readable metadata.
Charlie
in Becoming an XBRL Master Craftsman
|
Post a Comment
| Email
| Print
Understanding and Managing Variability of Financial Reports
The financial reports of economic entities creating using US GAAP, IFRS, and other such robust reporting schemes includes variability.
This variability is an essential, characteristic trait of such reporting schemes and contributes to the richness, high-fidelity, and high-resolution of reported financial information. This variability is a feature of such reporting schemes.
Here is one example of such variability. The FASB discusses variability as it relates to US GAAP in the conceptual framework, specifically Statement of Financial Reporting Concepts No. 6. For example, on page 47, paragraph 77, you see:
 (Click image for larger view)
That specific discussion relates to comprehensive income, but the same general idea applies to most aspects of a financial report.
As I said, this variability is not unique to the FASB and US GAAP, for example, if you look at IPSAS issued by the International Public Sector Standards Board you see the same ideas.
But "variability" does not mean "arbitrary" or "random". Variability must be managed and controlled to keep it within proper limits.
There are "clusters" of acceptable, standard ways to create financial reports, not just one way. I call these "clusters" by the term "pattern". Here are examples of some of those clusters:
- Reporting styles: The styles that companies use to report have clusters. I call these reporting styles. US GAAP has reporting styles, IFRS has reporting styles. Other reporting schemes likewise have clusters of reporting styles.
- Fundamental accounting concept relations: It may be the case that "Assets = Current Assets + Noncurrent Assets"; or it might be the case that "Assets = Current Assets + Fixed Assets + Other than Fixed Assets". There are many other such relations. You can measure these relations within financial reports.
- Disclosure Mechanics: Disclosures in a financial report are clustered. Not every company reports every possible disclosure, different companies might pick between different alternatives.
That is a good example of the variability within a financial report.
The Method of Implementing a Standard Digital Financial Report Using the XBRL Syntax is an approach to managing and controlling that variability. There are other approaches to managing therefore controlling variability. However, you cannot simply ignore the variability.
This method uses machine-readable business rules to "channel" and therefore control variability, keeping the variability within standard limits. That keeps quality where it needs to be. Rules enable things like preventing a user from using a concept meant to represent one thing from unintentionally being used to represent something different.
Managing variability is essential to representing the high-fidelity, high-resolution information that is contained in a financial report at the high-quality level necessary for such reports.
Charlie
in Becoming an XBRL Master Craftsman
|
Post a Comment
| Email
| Print

