BLOG: Digital Financial Reporting
This is a blog for information relating to digital financial reporting. This blog is basically my "lab notebook" for experimenting and learning about XBRL-based digital financial reporting. This is my brain storming platform. This is where I think out loud (i.e. publicly) about digital financial reporting. This information is for innovators and early adopters who are ushering in a new era of accounting, reporting, auditing, and analysis in a digital environment.
Much of the information contained in this blog is synthasized, summarized, condensed, better organized and articulated in my book XBRL for Dummies and in the chapters of Intelligent XBRL-based Digital Financial Reporting. If you have any questions, feel free to contact me.
Entries from June 1, 2014 - June 30, 2014
XBRL Definitions Prohibition Example
In my prior blog post I talked about how XBRL can be used to prohibit relations. So I created an example of this and show how it would be used. I will walk you through how I did this.
Here is the end result: XBRL Taxonomy Schema, XBRL Definition Relations. (Both of these should load into any quality XBRL tool. If you can use the Arelle GUI which is open source.)
So here is the use case. OK, there are some set of business rules which have been defined, organized, and generated in the XBRL format such as these which I used in that prior blog post. But those rules are somewhat LAX, you want a more STRICT set of rules. Say you want to do the following:
- You don't want to allow the concept us-gaap:LiabilitiesAndPartnersCapital because it has been deprecated
- You dont want to allow the concept us-gaap:CommonStockholdersEquity because it has also been deprecated.
- You don't want your company to use the concepts us-gaap:OrganizationConsolidationAndPresentationOfFinancialStatementsDisclosure, us-gaap:OrganizationConsolidationAndPresentationOfFinancialStatementsDisclosureAndSignificantAccountingPolicies, us-gaap:OrganizationConsolidationBasisOfPresentationBusinessDescriptionAndAccountingPoliciesDisclosure because you would prefer your organization to break each disclosure into the individual pieces, rather than pack several disclosures together.
Here is how you prohibit those relations which disallow those options:
- You create an empty XBRL taxonomy schema. Here is an example. That is just a schema which references the XBRL schema.
- You import the set of business rules you are using. That is the business rules from the previous example in this case.
- You save the schema then open it in your XBRL taxonomy editor and create new relations which prohibit the existing relations.
- You resave the schema and your XBRL taxonomy editor will automatically save the definition relations you articulated and link it to your taxonomy schema. (Again, this is the end result which is the same as above: XBRL Taxonomy Schema, XBRL Definition Relations)
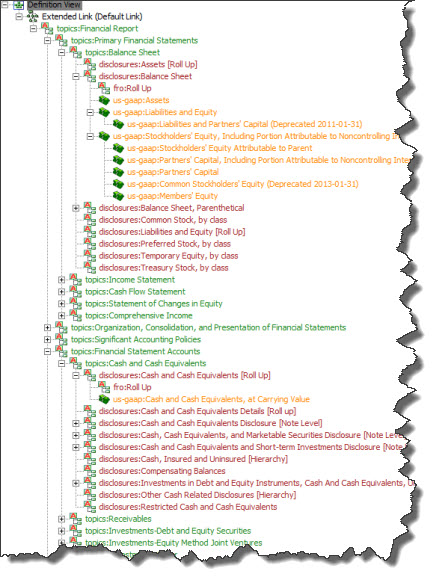
Visually, what you created looks something like what my XBRL taxonomy editor shows in the graphic below:
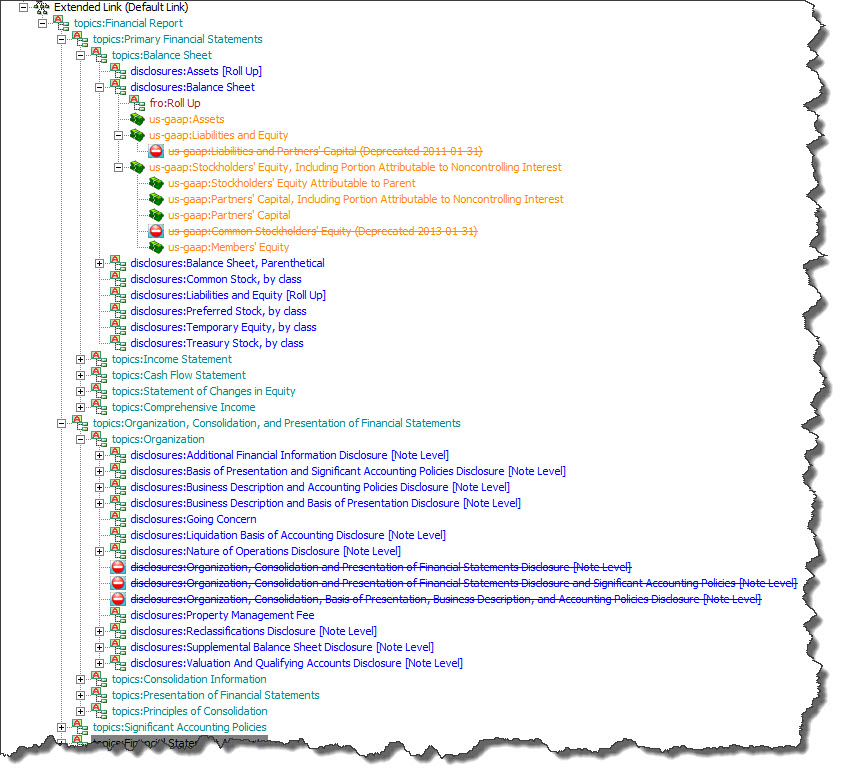 (Click image for larger view)
If you look at the XBRL definition relations, you will notice that you did not really delete anything. You cannot do that because you don't "own" the business rules. You cannot edit those. What you do is create new relations which prohibit the existing relations. You can see this if you look at the XBRL Definition relations, notice the use='prohibited' attribute on the definitionArc element.
That is all there is to it.
 Charlie
in Becoming an XBRL Master Craftsman
|
Charlie
in Becoming an XBRL Master Craftsman
|
 Post a Comment
|
Post a Comment
|  Email
|
Email
|  Print
Print
Understanding the Power of XBRL Graphs
Graphs are amazing little tools. When I say graphs, I mean the graph theory definition of a graph which is "structures used to model pairwise relations between objects". And in writing that, I don't know if it is the graphs that are amazing or if it is the formats used to represent graphs which is amazing.
This is what I mean.
RDF is an approach to expressing things using a graph-type format. Basically you represent what amounts to a flat list of stuff and then software which processes RDF organizes the flat list of stuff into relationships generally displayed in the form of a "tree". This offers a lot of flexibility.
Well, XBRL does the same thing. Or rather, XLink does the same thing and XBRL leverages XLink so in that way XBRL can express graphs. XBRL presentation relations, calculation relations, and definition relations are graphs.
So here is a very basic example. Below is a "tree" which represents information about financial reporting topics expressed using XBRL. This is the XBRL definition linkbase which expresses those relations.
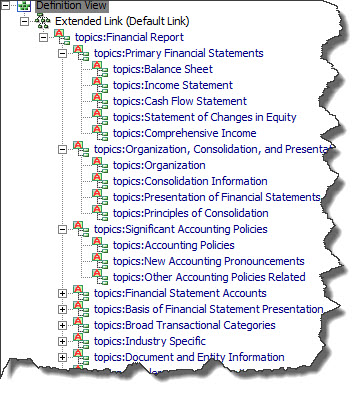 Topics
If you go look at the XBRL definition relations you will see that there is a flat list of stuff. The XBRL processor takes that flat list and renders a human readable view of the information.
So here is another set of XBRL definition relations which have information about financial reporting topics and also has information about financial disclosures. The disclosures refer to the topics in order to organize the disclosures into the related topic. (Here is the XBRL definition relations for the topics and disclosures.)
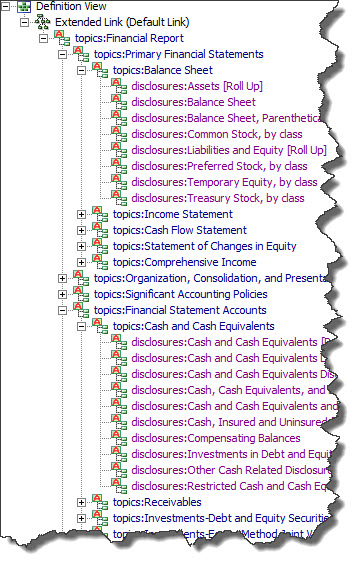 Topics plus Disclosures
So basically, the list of topics and the list of disclosures are combined into ONE list. (Bear with me for a moment here.)
OK, so here is another list I created. This is interesting for two reasons. First, notice that the information is flat. Second, that is actually not just one XBRL definition linkbase. That is a set of about 221 XBRL definition linkbases which are combined together using this XBRL taxonomy schema. (Here is one example set of business rules, I will explain those in another blog post.)
 Business rules
This is where things get really interesting.
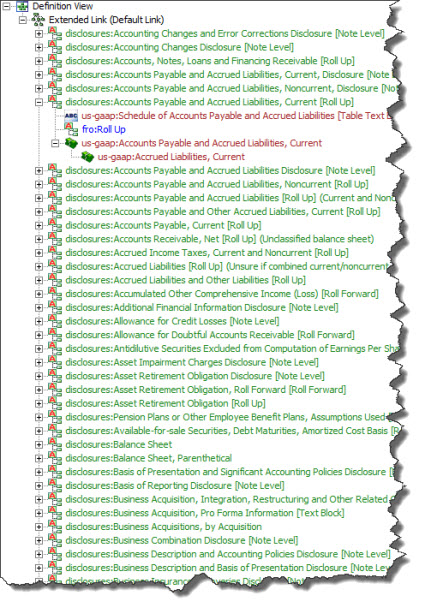
Below you see the financial reporting topics, the financial disclosures organized by topic, and then the business rules that I created organized by financial disclosure. I put all those pieces together with this XBRL taxonomy schema. For good measure and so I can read the information using labels rather than just element names, I added the US GAAP XBRL Taxonomy and DEI Taxonomy labels.
 Topics, Disclosures, Business Rules
Because I organized the information correctly and paid attention to the extended link roles I used, all of these pieces are merged into one graph by the XBRL processor which displays that information. XBRL was designed this way in order to provide the extensibility which was required as a feature. Here you see that feature in action.
That may not seem like much, but when you think about it the utility of this starts to make sense. Ever try and merge to XML hierarchies together? There is no standard way to do that. You can physically merge two hierarchies of things, but someone has to write code to make that happen on a case-by-case basis. Same deal with combining two relational database tables. You can do it, but there is no global standard way to do it and you have to again combined things on a case-by-case basis. XBRL (via XLink) and RDF both allow for this type of flexibility.
But wait, there is even more! XBRL has two additional useful features. I don't think that RDF has either of these, but I need to check some more to be sure. The first is the ability to partition graphs into different networks. What this allows is different sets of things which can never collide. Networks basically keep sets distinct. I think you can achieve this using RDF by physically separating information into different files.
The other feature is prohibition. Say you don't like a relation which has been expressed. Well, XBRL allows you to turn the relationship off by prohibiting the relation. XBRL basically provides and "audit trail" so to speak so you can track the expression of the relation, if someone turned the relation of, and then even if someone recreated the relation. Of course, the system making use of XBRL can allow or disallow prohibition. (Here is a prohibition example I created.)
The bottom line here is that graphs offer flexibility and XBRL can articulate graphs of information. The way most others use XML, they cannot do this and there is certainly not a global standard way to do this, each case is therefore a point solution which requires someone writing code. Same for relational database tables, particularly across systems.
Charlie
in Becoming an XBRL Master Craftsman
|
Post a Comment
| Email
| Print
Beating Down Complexity
Simple is not easy, simple is hard.
"Simple" is not about doing simple things. Simplicity is the ultimate sophistication. Make sophisticated things simple.
These are ideas, ideas which I try and live by, discussed in this presentation; Simplify Everything. Do Anything.
This prototype is my idea of simple. It can be simplified even more.
Simple is elegant.
Charlie
in General Information
|
Post a Comment
| Email
| Print
Comparing XBRL Implementation Alternatives
In order to understand different implementation altrenatives I compared each of the alternatives that I could see using the constraints that I believe are important. This is what I came up with:
There seems to be the following alternative data storage options for implementing an XBRL based system:
- File system: Store information as files in your file system.
- Relational database: Put the data into a relational database.
- Multidimensional database: Put the information into a multidimensional database.
- RDF triple store: Put the information into an RDF triple store.
- NoSQL database: Put the information into a NoSQL database.
There appear to be two different storage strategies which one might use:
- XBRL technical syntax format: Store information in the raw XBRL technical syntax format.
- Queriable semantic oriented format: Convert the XBRL technical syntax into a more queryable semantic oriented format so that you don't need to convert the information at query time, thus hindering performance.
These seem to be the important evaluation criteria:
- Easy for business user to use (intuitive): Is the system EASY or HARD for a business user to use?
- Query power and query sophistication: Is the query language POWERFUL or UNSOPHISTOCATED?
- Performance, query speed: Is query performance FAST or SLOW?
- Expressive power: Is the system EXPRESSIVE or INEXPRESSIVE?
- System flexibility, agility: Is the system FEXIBLE or INFLEXIBLE?
- System scalability: Is the system SCALABLE or NOT SCALABLE?
- Global standard: Is the system STANDARD or PROPRIETARY?
- Cost effective: Is the system INEXPENSIVE or EXPENSIVE?
- Maintainability: Is the system EASY TO MAINTAIN or HARD TO MAINTAIN?
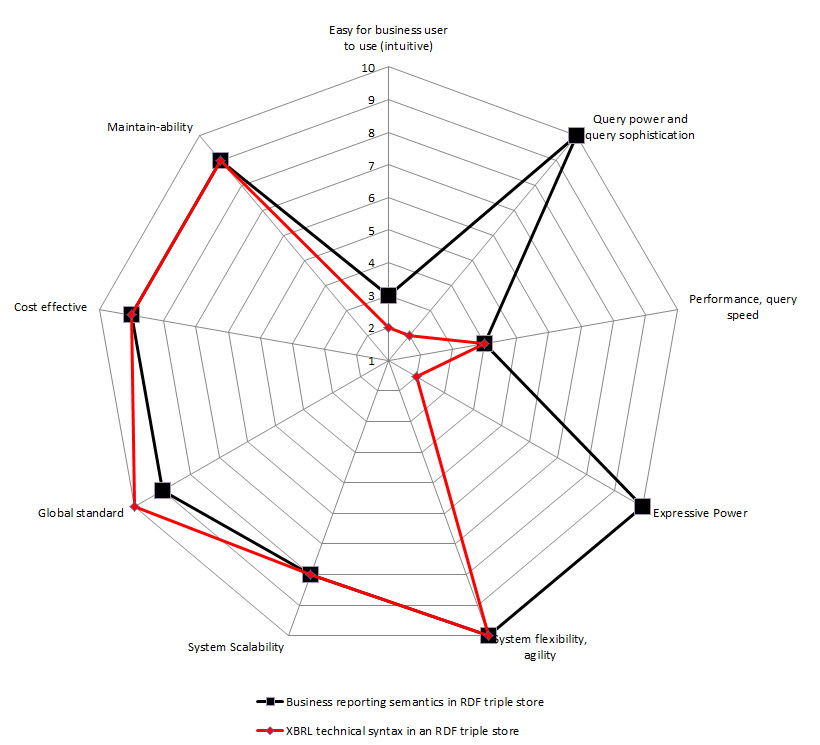
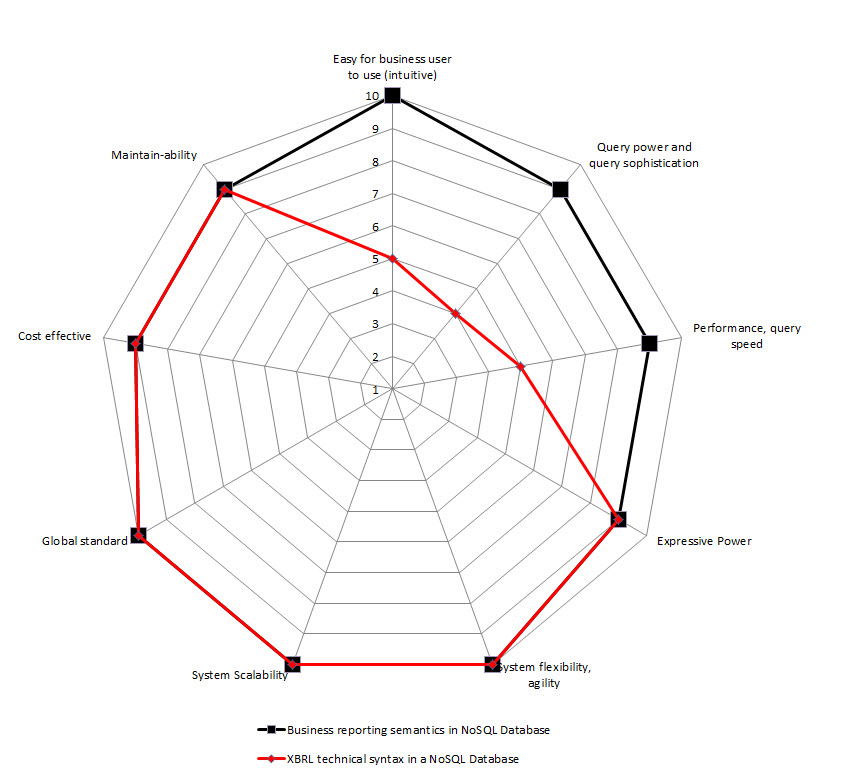
So, I created radar charts for each of the options for implementation from above. On the chart I show two sets of data: one for storing the XBRL technical syntax (in RED), the other for storing a more business semantics oriented format (in BLACK). I assigned values for each of the 9 constraints. The radar graphs below show the results that I get:
File system
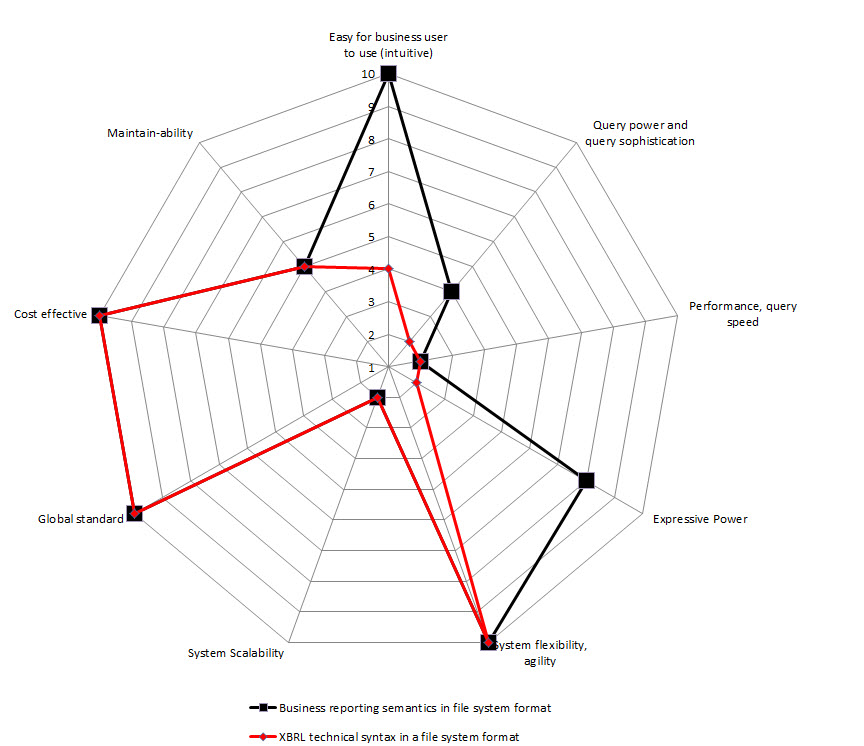 (Click for larger image)
Relational database
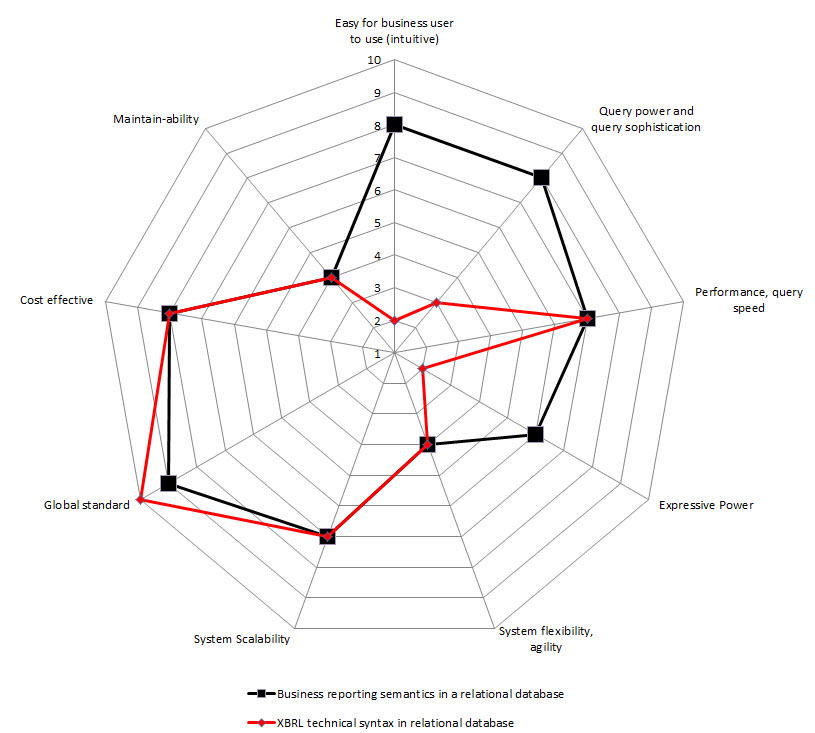 (Click for larger image)
Multidimensional database
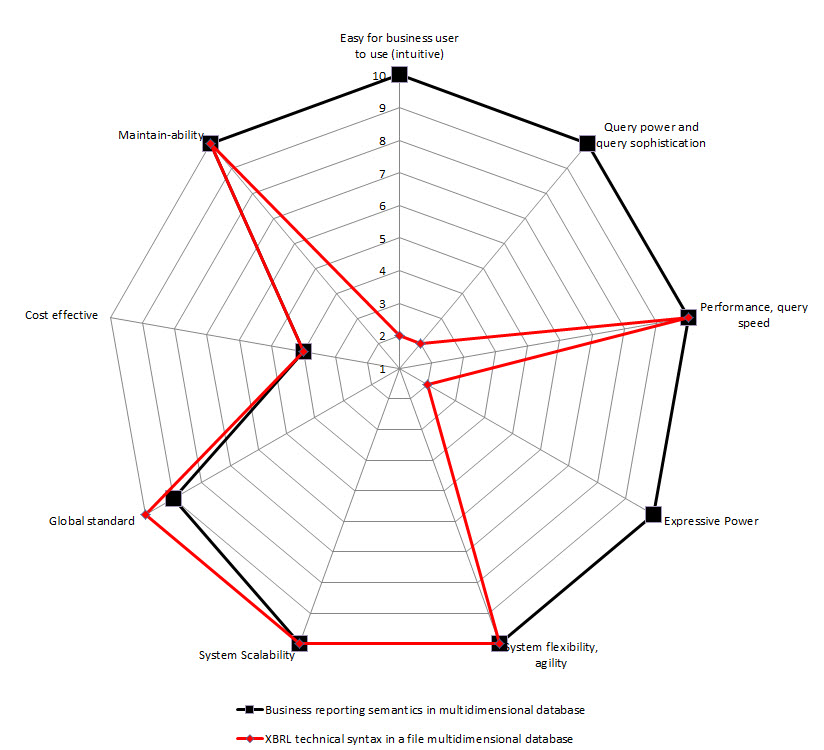 (Click for larger image)
RDF Triple Store
 (Click for larger image)
NoSQL Database
 (Click for larger image)
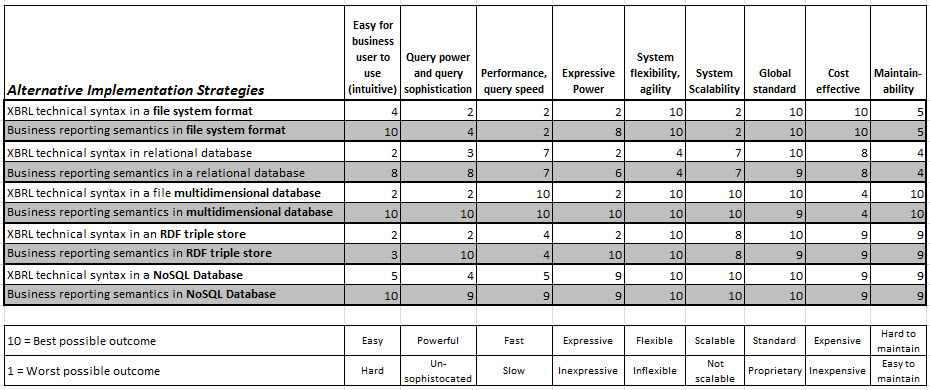
This is the raw data that I used to populate the radar charts:
 (Click image for larger view)
If you don't like the values I assigned for each alternative for each of the constraints, here is the Excel spreadsheet which I used, assign your own values.
You can download the radar graphs and data which are summarized in this PDF.
Reach your own conclusions.
Charlie
in General Information
|
Post a Comment
| Email
| Print
Disclosure Research Tool Prototype
I created this US GAAP disclosure research tool (prototype). Disclosures are gleaned from SEC XBRL financial filings. This is another version.
What do you think? Useful?
Charlie
in Demonstrations of Using XBRL
|
Post a Comment
| Email
| Print

