BLOG: Digital Financial Reporting
This is a blog for information relating to digital financial reporting. This blog is basically my "lab notebook" for experimenting and learning about XBRL-based digital financial reporting. This is my brain storming platform. This is where I think out loud (i.e. publicly) about digital financial reporting. This information is for innovators and early adopters who are ushering in a new era of accounting, reporting, auditing, and analysis in a digital environment.
Much of the information contained in this blog is synthasized, summarized, condensed, better organized and articulated in my book XBRL for Dummies and in the chapters of Intelligent XBRL-based Digital Financial Reporting. If you have any questions, feel free to contact me.
Entries from June 1, 2014 - June 30, 2014
Digitizing Disclosures (Part 1)
In Part 1 I want to give you a sense that disclosures can be digitized. In Part 2 I will show the benefits of digitizing disclosures. In Part 3 I will get into specific details of disclosures.
There has never really been a list of financial report disclosures. Until now that is. Here is one list that I created. Here is another list from the US GAAP XBRL Taxonomy.
Physical List of Disclosures
What I mean by a list is literally just that: a physical list of all the disclosures and each disclosure is assigned a unique name so you can refer to that disclosure.
The Accounting Standards Codification (ASC) does not provide a list of disclosures. The ASC describes what an economic entity needs to disclose, but does not have a comprehensive list of all the disclosures. A disclosure checklist (here is a KPMG disclosure checklist) does not have a list of disclosures; it likewise describes what needs to be disclosed. An intermediate accounting text book does not even have a list of disclosures.
What if there was a complete list of disclosures? What if each of the disclosures was given a name and the disclosure was described so that users can understand each disclosure and distinguish one disclosure from another.
Well, the US GAAP XBRL Taxonomy has such a list. The list is not totally complete, but the list has improved substantially over the years and it will continue to improve. Here is the US GAAP XBRL Taxonomy list, the comprehensive list of text blocks.
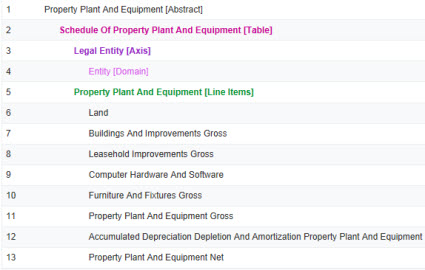
Here is one of the disclosures: Property, Plant and Equipment [Table Text Block]. The description of that disclosure in the US GAAP XBRL Taxonomy is as follows:
Tabular disclosure of physical assets used in the normal conduct of business and not intended for resale. Includes, but is not limited to, balances by class of assets, depreciation and depletion expense and method used, including composite depreciation, and accumulated deprecation.
This web page provides a list of public company examples of the footnote that the property, plant and equipment disclosure typically goes into. These are "Level 1" text blocks, at the footnote level. There are about 53 examples, notice how similar they are. And this is the "Level 3" or disclosure level text blocks. Again, these are similar and are part of some Level 1 footnote level text block.
Here is one of those examples, for Microsoft:
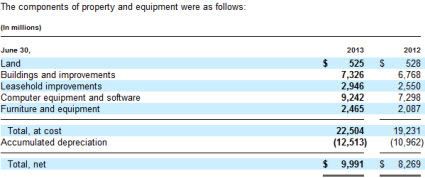
A lot of public companies provide this disclosure in their financial report. That disclosure is more similar than it is different. Here is a comparison of about a sample of 40 reporting entities which provided this disclosure selected at random. From this document you will note the following:
- Every Level 3 text block disclosure provides the same information, the breakdown of the detailed items which make up the total of property, plant, and equipment.
- The Level 3 text block is detailed by some set of Level 4 disclosure. I am not showing the Level 4 because I don't have a way to show those for SEC XBRL financial filings without some sort of software application. But here are two examples which show what those look like: Example 1 | Example 2
- Each one of these Level 4 disclosures is a Roll Up metapattern
- The Roll up is expected to foot (i.e. the detailed line items when added up will agree to the total amount)
- Most Level 4 disclosures have the following concept as the total of the Roll Up: us-gaap:PropertyPlantAndEquipmentNet; a few have the concept us-gaap:PropertyPlantAndEquipmentGross (not sure what to think about that)
- Each of the Level 4 disclosures ties to the balance sheet which has that total within the balance sheet
- Each of the Level 4 disclosures has an equivalent Level 3 disclosure
- Each of the Level 3 disclosures exists within some Level 1 footnote level text block; it does not necessarily have to be the us-gaap:PropertyPlantAndEquipmentDisclosureTextBlock, it could be a handful of other common places this information is presented within a financial statement (see the PDF referenced above for more information on this)
- Not in that document but every accountant knows that if you have property, plant and equipment you are going to also need to disclose the estimated useful lives of each class of PPE so you will need that disclosure also
- This PPE disclosure could have been represented using a Concepts within a set of [Line Items] or as a set of [Member]s of an [Axis]. Either is appropriate. But you don't want to mix the two approaches in the same disclosure.
So does your disclosure management tool or XBRL creation application help you manage all of the above? What does your software tool do to make sure you get all of this correct? Most likely not much. Why is that?
Structured Information
How can software help the user of that software do all of the things mentioned in that bulleted list above? Well, because the information is "digital" or "structured". Software can address the individual pieces of the XBRL-based digital financial report.
This rendering of the Level 4 detail of the PPE items is a little bit different format then you might be used to, but the information is the same. Notice how the information is broken down into identifiable cells. (The previous rendering was also broken out into cells in the word processor used to create the more common rendering, you just don't see the "cells" because the formatting of that table above does not call for those lines to be shown. If you don't understand what I am saying, watch this video, How XBRL Works)
 (Click image for larger view)
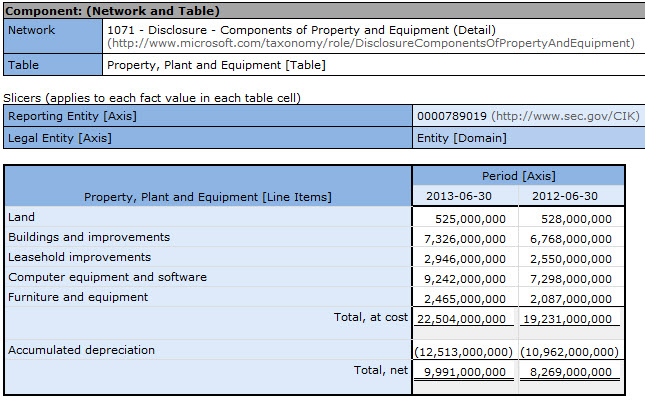
Again, I cannot link you to an SEC XBRL financial filing, but I can link you to this example which shows you yow that disclosure looks digitally.
No real difference in the information really, it looks a little different because of the way the software that rendered that information creates the rendering. Here is another rendering of the same disclosure by a different software application (the SEC web site):
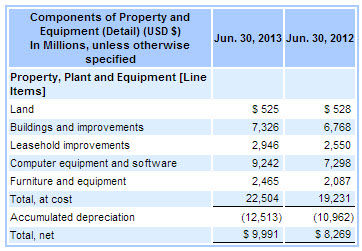 (Click image to go to filing on SEC web site)
Now, that rendering can be broken down into distinct, individual facts. Basically, one distinct fact for each number in the disclosure. Here you can see the individual facts which make up that disclosure:
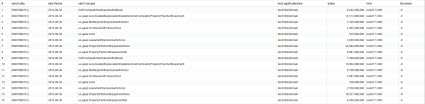 (Click to view fact table of individual disclosure pieces)
While the facts above a just a list, here is information on how to order that list of facts which make up this disclosure. Here is an organization of those pieces, probably not too familiar a way of seeing this information, but I think most accountants can understand the information:
(Click to view the model structure of the disclosure)
Digital Disclosures
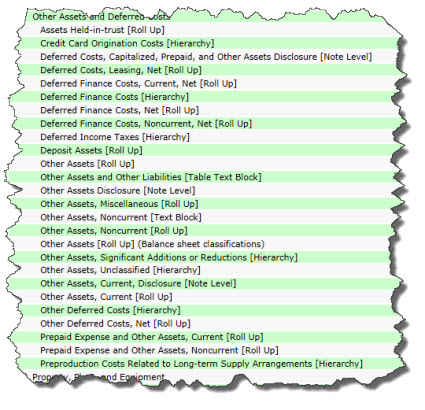
So let us get back to the disclosures for a moment. I also have a list of disclosures. Here is my list. You can see part of the list below:
 (Click to view complete list)
Here is another version of my list in PDF. This is the master list of my disclosures. That list is machine readable and used to create all the other lists. I have reconciled my list to the US GAAP XBRL Taxonomy list. The reason that I maintain a list of disclosures is that: (a) the US GAAP XBRL Taxonomy is missing a lot of [Text Block]s and (b) because the US GAAP XBRL Taxonomy does not map the Level 4 disclosures to the Level 3 [Text Block]s. I can and do have such a mapping.
Why do I need to identify each individual disclosure? Lots and lots of reasons. I will get into this in Part 2. Stay tuned, you won't want to miss that post.
Here is a very basic way you can look at examples of each disclosure. Here is a slightly different prototype.
You can build software which uses these disclosures. For example, you can use this software application (if you are running Microsoft .NET 4.5) to look at examples of many of these disclosures (I think I have examples for about 300 of the 986 disclosures.) (This application is actually better, but you have to have a software license to use it.) Think about it; How would I provide a list within the application if I did not have some list which was readable by the software application? Does your software application provide a list of disclosures?
Also, keep in mind that more than just the disclosures are digitized. Here is a lot of other information which has been "digitized" and put into machine-readable form. You can use the Topics to organize the disclosures for example. The key idea hear is to make things machine-readable.
Bottom Line
What I showed you in detail for the one property, plant and equipment items breakdown disclosure is applicable to each of the other approximately 1000 disclosures I have on my list and which exist in the US GAAP XBRL Taxonomy.
While I would rather there be one list provided by the US GAAP XBRL Taxonomy, until that list is right, I will maintain my own list. Also, by maintaining my own list I have an abstraction layer between software which uses my list and errors which might exist in the US GAAP XBRL Taxonomy. I can fix my errors in a more timely manner, I don't have to wait months and sometimes years for the US GAAP XBRL taxonomy to deal with issues/problems.
 Charlie
in Becoming an XBRL Master Craftsman
|
Charlie
in Becoming an XBRL Master Craftsman
|
 Post a Comment
|
Post a Comment
|
 8 References
|
8 References
|  Email
|
Email
|  Print
Print
Updated Digital Financial Report Viewer (Prototype) and Metadata
I have updated my metadata and made some minor updates to my Digital Financial Report Viewer (Prototype).
The biggest change is the metadata. I have three sets:
- Very common: This has 219 very common disclosures.
- Has example: This is 458 disclosures, every disclosure for which I have at least one example.
- Has rules: This is a set of 53 disclosures which have examples and also has business rules and prototypes. This is used by software vendors for testing their software.
More to come soon, stay tuned. The age of digital disclosures is almost here!
Avoiding Poor Representation Choices in SEC XBRL Financial Filings
I was talking with someone about the use of "dimensions" by public companies creating SEC XBRL financial filings. They said something that helped me think of something.
The XBRL Dimensions Specification defines the term "dimension". Per the specification (and therefore how dimensions actually work), a dimension is defined as:
"Each of the different aspects by which a fact MAY be characterised."
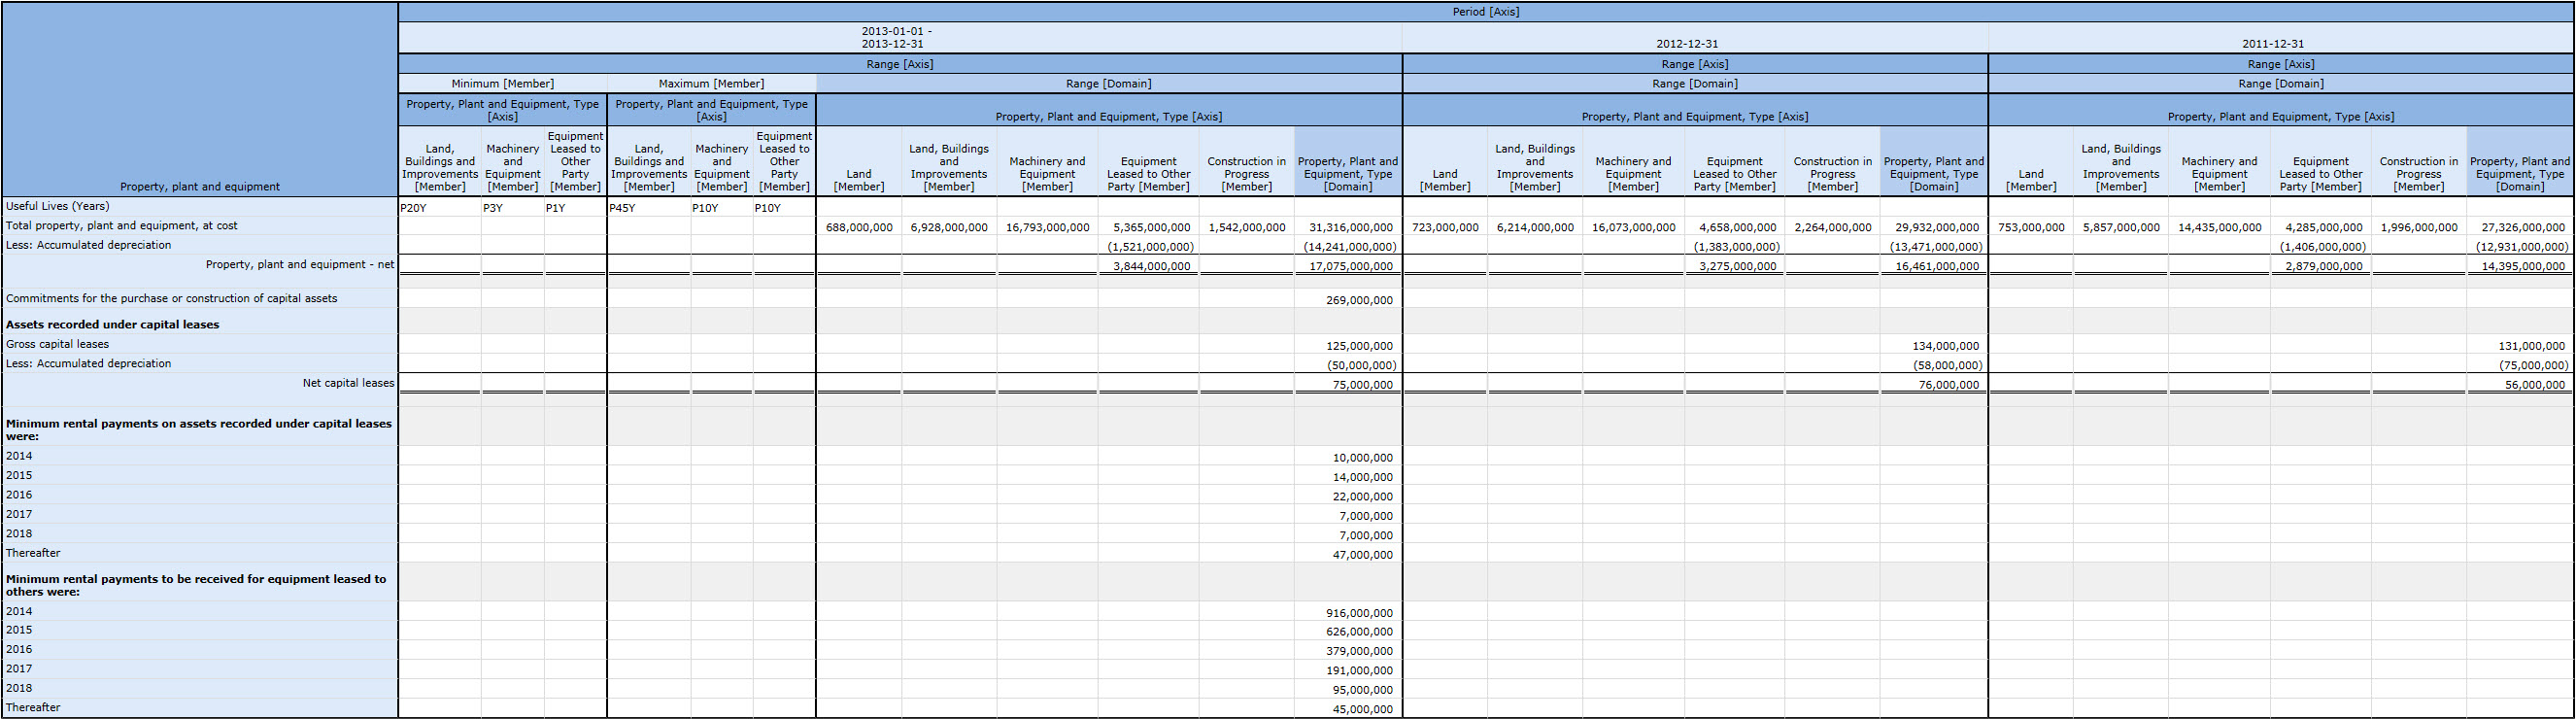
What gets people into trouble is they try to use dimensions to both characterize and present information. Take this example:
 (Click image for larger view)
If you look closely at the image you see a "Range [Axis]". That Range [Axis] characterizes some information, it does not characterize other information.
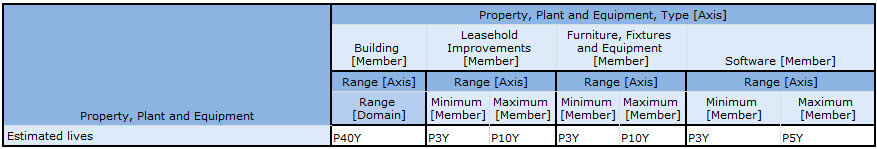
Contrast the above example to this example: (estimated useful lives)
 (Click image for larger view)
Notice two things. First, it is very easy to read. Second, there are not any empty cells like in the first example. Third, it is rational and logical and therefore understandable.
And now see this example: (PPE by type)
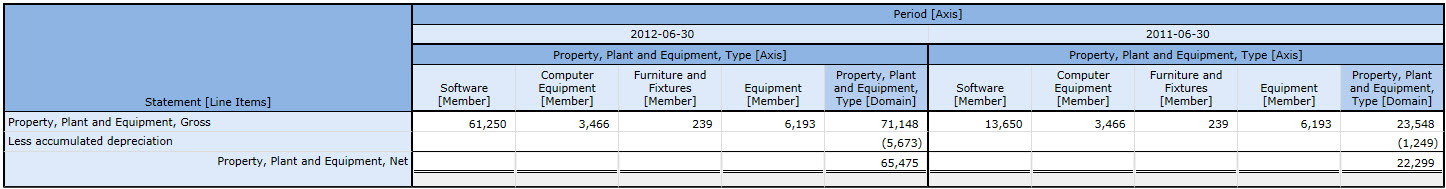 (Click image for larger view)
Same things. Easy to read, some empty cells but not too many, rational and understandable.
And finally, one last example: (minimum lease payments)
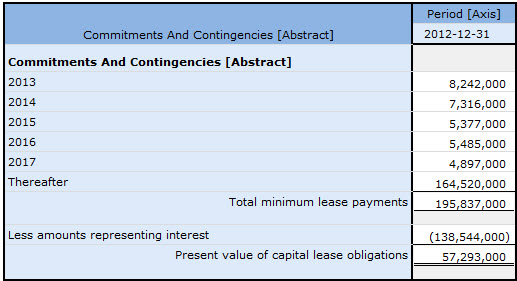 (Click image for larger view)
Notice how if you take that one big thing and break it down into a number of smaller separate things, that everything is readable and understandable. The understanding exists not only for the humans trying to read and use this information, machines trying to read this information also finds the information understandable if it is properly represented.
If a fact cannot be characterized by a dimension or [Axis], that [Axis] does not belong on the fact. That means accountants representing information should not put facts together in the same [Table] (in XBRL Dimensions Specification terminology a hypercube) if they have different characteristics.
Charlie
in Becoming an XBRL Master Craftsman, XBRL Dimensions Tutorial, XBRL dimensions examples
|
Post a Comment
| Email
| Print
Policies and Disclosures Viewer Prototype
I expanded upon my first quick prototype, building out the idea for all US GAAP XBRL Taxonomy text blocks. This is a screen shot of what I put together:
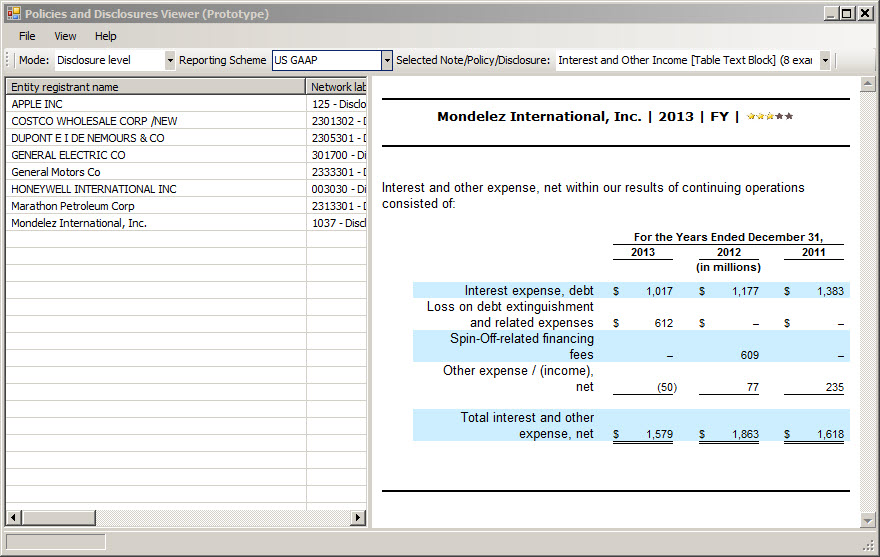 (Click image for larger view) Here are two more screenshots: Screenshot 1, Screenshot 2.
If you have Windows 7 and the Microsoft .NET Framework 4.5, you can run this application for yourself here. Just click on the "launch" link on that page (or just click here).
If you cannot get the application to run so you can experience it yourself, you can see the application in action by watching this video.
Or another way is to use one of two HTML 5 interfaces: with iFrames and without frames. (Only one of the approximately 959 text blocks is shown)
As I explained in my first quick prototype, I simply took the process I created and then iterated over each of the text blocks provided in this XML file which a representation of information from the US GAAP XBRL Taxonomy "Comprehensive Text Block List".
Charlie
in Demonstrations of Using XBRL
|
Post a Comment
| Email
| Print

