BLOG: Digital Financial Reporting
This is a blog for information relating to digital financial reporting. This blog is basically my "lab notebook" for experimenting and learning about XBRL-based digital financial reporting. This is my brain storming platform. This is where I think out loud (i.e. publicly) about digital financial reporting. This information is for innovators and early adopters who are ushering in a new era of accounting, reporting, auditing, and analysis in a digital environment.
Much of the information contained in this blog is synthasized, summarized, condensed, better organized and articulated in my book XBRL for Dummies and in the chapters of Intelligent XBRL-based Digital Financial Reporting. If you have any questions, feel free to contact me.
Entries from March 1, 2011 - March 31, 2011
XBRL Techniques and Trends, Prototype 2
Every weekend I try and do some experimentation with XBRL. Last weekend I created a prototype of what I call XBRL Techniques and Trends. This weekend I built upon that base and created XBRL Techniques and Trends 2.
This second prototype is closer to what a real tool such as this might work. Again, granted, it is limited because of my lack of programming skills, but I think it shows where this can go. This version has actual information from the filings whereas the first version showed information from the XBRL taxonomy. Both are useful, the actual information is more useful it seems to me.
Be aware that my prototype works against a set of only 1474 SEC XBRL filings. These filings are all 10-Ks and 10-Qs. But, some are still in the block tag phase, others detail tag their filings. Notice that you can navigate back to the SEC Interactive Information Viewer rendering from the filing from which the fragment comes.
While this only shows single concepts, mostly policies but a few disclosures; this could handle multiple facts reported also, but that would require the ability to render the information.
Imagine taking this to the next level by sending a search engine against the concepts. Because you know the context of what you are searching against, the information returned will be both more accurate and more useful.
Imagine having this type of information available within a software application which you are using to create a financial report. And I am not talking about Microsoft Word, although having the information available using that soon to be legacy process might be helpful; imagine if the software application "understood" US GAAP. How can software understand US GAAP? Well, that possibility is provided by the structured nature of XBRL. Now, you do get some of this information from the US GAAP Taxonomy today, you will get far, far more information as more meta data is added to the taxonomy. Things like "if this is disclosed, then this must be disclosed" are easy for a computer to check. Today we call that a disclosure checklist. Can a computer do everything? Certainly not. Another thing a computer can do is make sure all the computations foot, cross cast and otherwise tick and tie. That is easy for a computer, harder for a human who can loose focus or get tired.
People are beginning to realize that XBRL is far more than a punitive regulator mandate. This will get easier and easier as more and more software, such as (but much better than) things like my little XBRL Techniques and Trends prototypes show where all this XBRL stuff is leading.
What ideas do you have for useful software which can leverage the nature of XBRL? Leave me a comment, I may have some time during a weekend to build another prototype.
 Charlie
in Creating Investor Friendly SEC XBRL Filings, Demonstrations of Using XBRL
|
Charlie
in Creating Investor Friendly SEC XBRL Filings, Demonstrations of Using XBRL
|
 Post a Comment
|
Post a Comment
|  Email
|
Email
|  Print
Print
IASCF Releases 2011 IFRS XBRL Taxonomy
The IASCF released the 2011 version of the IFRS XBRL Taxonomy. You can get to the taxonomy information here.
Also, if you are not aware of it, I want to point out the "Global Filing Manual". The global filing manual is described as follows per the web site:
The Global Filing Manual contains a set of rules which provide guidance on the preparation, filing and validation of XBRL filings created using the IFRS Taxonomy, the EDINET (Electronic Disclosure for Investors’ NETwork) Taxonomy or the U.S. GAAP Taxonomy. It is the first set of aligned XBRL (eXtensible Business Reporting Language) filing rules for global use and has been published by the Interoperable Taxonomy Architecture (ITA) project.
Understanding Common Reporting Characteristics Expressed as [Axis]
The common characteristics of an SEC XBRL financial filing are misunderstood many times. These characteristics are expressed as explicitly defined or implied [Axis]. Generally filers will never need to re-create these in their extensions. Here is an overview of these common characteristics.
Fundamentally, when you think of all this, think in business terms, not technical terms. After all, it is business information which is being expressed. I will point out the XBRL syntax which instantiates these business semantics, but you can ignore this. I am only pointing this out to help differentiate business semantics (which is important) from technical syntax (which is an unimportant detail you can ignore). Hear are common [Axis] nearly every filer uses.
- Reporting Entity [Axis]. Every fact reported is associated with a reporting entity. That is the filers CIK number. This [Axis] is explicitly articulated using the XBRL syntax as the "entity identifier". But it is an [Axis], it is always there, and it will always be the CIK number of the filer.
- Period [Axis]. Every fact reported is also explicitly associated with a period. This period can only be articulated in a "calendar period" form. It would be good to be able to articulate fiscal period information, but the XBRL syntax cannot do that in its current form. So, this period is really a calendar period only, it is always required, and is expressed in the XBRL syntax as the "period" portion of a context.
- Report Date [Axis]. The report date is typically the date of the SEC filing for those who file to the SEC or the auditor's report date for those who do not. There is a lot of vagueness surrounding using this, but the safe way to go is to use this strategy in my view. If you do not have a prior period adjustment, then everything in the report relates to the same date and this can be implied. If you do have a prior period adjustment, then you need to explicitly use the Report Date [Axis] to differentiate originally reported and restated values. I won't get into details about this here. If this axis does not exist, then the report date of the SEC filing or auditor report can be implied.
- Legal Entity [Axis]. The legal entity of a fact is implied to relate to the "consolidated entity" unless it is explicitly associated with some other legal entity. If you explicitly put the "Legal Entity [Axis]" onto a [Table] and you use the "Entity [Domain]" which really means "Consolidated Entity [Domain]", it means the exact same thing as not providing the information at all. Personally, I think it is better to be explicit.
- Business Segment [Axis]. When breaking your filing information out by business segment, you need to use the business segment [Provided]. If this does not exist, then total for all business segments is implied.
- Geographic Areas [Axis]. When breaking your filing information out by geographic areas, you need to use the geographic area [Axis]. If this does not exist, then total for all geographic areas is implied.
- Reporting Scenario [Axis]. Some times you might need to differentiate information which is actual, budgeted, forecast, etc. This is what the Reporting Scenario [Axis] is for. If you don't explicitly use it, then facts are implied to be actual.
- Operating Activities Segment [Axis]. This [Axis] helps you differentiate continuing operations and discontinued operations. If it does not exist, facts are implied to relate to continuing operations.
- Products and Services [Axis]. This lets you break information down by product/service. If it does not exist, it is implied to mean all products and services.
- Major customers [Axis]. This lets you break information down by customer. If it does not exist, all customers are implied.
You can see a complete list of these [Axis] defined by the US GAAP Taxonomy here in my reorganized version of the taxonomy or in the actual US GAAP Taxonomy using this viewer application. Remember that you will not see the Reporting Entity [Axis] or the Period [Axis] as they are expressed using the context within your XBRL instance (i.e. a different syntax). But both are [Axis].
You can see how filers are expressing business segments and geographic areas in my XBRL Techniques and Trends comparison tool. Realize that there are both good and bad examples, so be careful!
Again, you will generally never need to create these [Axis] for yourself, use the ones which exist.
Charlie
in Creating Investor Friendly SEC XBRL Filings, Creating SEC XBRL Financial Filings
|
Post a Comment
| Email
| Print
XBRL Techniques and Trends Helps You See Possibilities
XBRL Techniques and Trends is a working, useful prototype I have created which helps you see some of the possibilities XBRL enables. What XBRL Techniques and Trends currently does is provide an interface which allows you to look at the XBRL taxonomies used by SEC XBRL filers. This prototype uses a set of 1474 SEC XBRL filings which I analyzed to see what the XBRL was looking like.
You can sort the list of filings by company name, form type, SIC code/description and the one I find most interesting by accounting topic. The way the accounting topic sort works is that I look at the filings by network and put similar networks together on one web page. This is quite easy to do.
If you have ever used the popular AICPA publication Accounting Trends and Techniques, you can probably use your imagination and see what might be possible here. My first prototype of what XBRL could bring to something like Accounting Trends and Techniques was over ten years ago and contributed to selling the idea of what was to become XBRL to others. I show the XBRL taxonomy because it is easy and because I am not a programmer. Think of not the XBRL taxonomy being shown, rather imagine the actual piece of the XBRL filing rendered to look just like in the financial statement. All the XBRL information is in structured form easily readable by computer software applications.
While Accounting Trends and Techniques uses only 600 filings because the process of putting that resource together is highly manual in nature, XBRL Techniques and Trends could make available every SEC XBRL filing creating a "long tail" of useful information. One specific example would be industry specific examples of disclosures for every industry and every type of disclosure. Another example of the possibilities is research.
What ideas do you have?
Charlie
in Demonstrations of Using XBRL
|
Post a Comment
| Email
| Print
SEC XBRL Edgar Data: Has a Beachhead Been Established?
It seems to me that a beachhead has been established by the SEC XBRL financial filing data set. This is particularly worthy of mention because from what I can tell, there really isn't even a beach master. While the SEC certainly has a lot to do with the success of getting their new XBRL-based EDGAR system up and running, I think there are others who are quite instrumental to this process also. Clearly the FASB plays a big role, they maintain the US GAAP Taxonomy used by the filers. XBRL US who got the initial version of the US GAAP Taxonomy is still contributing. The software providers and filing agents, of which there appear to be at least 15 that I can count, are stepping up to the plate. The filers themselves are pushing on the system, moving things in the right direction if only by caring about the XBRL that they submit. And, of course, the SEC itself contributes in two ways. First, directly by guiding the process and second by letting the others, the market, figure this XBRL thing out.
XBRL International and its members has also made quite a contribution. If you really think about it; at least 15 different software vendors and my set of 1474 filingsall readable by a software application created by a CPA with limited programming skills (that would be me) in Microsoft Access. Clearly commercial quality software will do the heavy lifting of making the XBRL-based information useful for multitudes of purposes, but simply being able to successfully read the individual files is success as far as I am concerned.
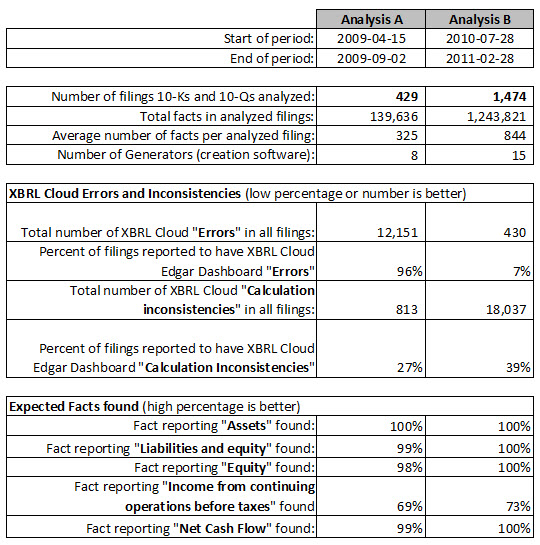
Sure, there is a lot of improvement needed before success can be declared. And we need to get the next tier of 8700 or so filers into the system. But from what I can see happening, I am optimistic about this next big increase in SEC XBRL filing volume.
Information from my analysis can be found here. The table below summarizes the key points. My focus is on basic consumption of the files and being able to gather foundational financial information. Assets. Liabilities and Equity. Total Equity. Income from continuing operations before taxes. Net cash flows. I would expect all of these concepts and I do see what I would have expected within the latest set of SEC XBRL financial filings.
What is your view? Are your expectations being met? Do you think a beachhead has been established? If so, why. If not, why not? Is the vision set by ex-chairman Christopher Cox and his team materializing?
Charlie
in General Information
|
Post a Comment
| Email
| Print

