BLOG: Digital Financial Reporting
This is a blog for information relating to digital financial reporting. This blog is basically my "lab notebook" for experimenting and learning about XBRL-based digital financial reporting. This is my brain storming platform. This is where I think out loud (i.e. publicly) about digital financial reporting. This information is for innovators and early adopters who are ushering in a new era of accounting, reporting, auditing, and analysis in a digital environment.
Much of the information contained in this blog is synthasized, summarized, condensed, better organized and articulated in my book XBRL for Dummies and in the chapters of Intelligent XBRL-based Digital Financial Reporting. If you have any questions, feel free to contact me.
Entries from March 1, 2014 - March 31, 2014
Understanding Syntax
Syntax, or technical syntax, is the physical format of the information. There are presentation formats and there are representation formats. These are some of the more common file formats (which are technical syntaxes):
- CSV (Comma Separated Values): Example
- Fixed Width: Example
- DIF (Data Interchange Format): Example
- PRN (Printer Information): Example
- ASCII Text: Example
- Plain Text: Example
- Excel (Binary): Example
- Excel XML: Example
- Word (Binary): Example
- PDF: Example
- RTF (Rich Text Format): Example
- HTML: Example
- HTML (view text): Example
- XML (Traditional): Example
- XBRL: Example
- RDF/OWL (Draft, needs work): Example
- JSON: Example
Each of those examples expresses the same information in a different way, using a different file format or technical syntax. Another way of saying this is that each file format has a different syntax but the information expressed is identical. There are lots of other file formats (see http://www.fileinfo.com/filetypes/data). Imagine having to write software to parse and use these different data formats. That is why global standard file formats are popular.
Looking at CSV you can learn some things about syntax. CSV (comma-separated values) is a simple ASCII file format that is widely used by business and scientific applications to exchange tabular data.
First, CSV is not a formal global standard format. CSV can be called a best practice or an ad hoc or informal standard. However, CSV is widely used, widely supported, and there are even a number of informal specifications. Excel supports CSV import and export; that is a specification in that if it works, it is right and if it does not it is wrong. IETF (Internet Engineering Task Force) created a specification, RFC-4180. CSV-1203 is another. Super CSV is another. Some guy in New Jersey created another.
The CSV-1203 best practice standard describes the problem they are trying to solve as follows: (emphasis is mine)
By adopting this standard, you place a prudent limit on the otherwise countless variations that could be implemented by systems developers. Its benefits are clearest when a CSV file forms an information bridge between two companies. Typically you should expect this standard to help reduce the time it takes to establish a data processing connection between your company and your clients or your service providers.
Business people tend to be very practical. Easier is better than harder. But for something to be useful to business people it has to work reliably, predictably, repeatedly.
But CSV "has problems" or limitations. It is more like trying to put a square peg into a round hole.
First off, there are three primary types (schemes/models/representations) for formatting and processing structured information (semi-structured, highly-structured):
- Table-type (homogeneous, tabular, consistent): relational databases, CSV, spreadsheets, or tabular-type representations which allow only one level of hierarchy within each table; but hierarchies can be constructed by relating tables
- Tree-type(heterogeneous, arborescent): XML, some XBRL application profiles, JSON and other tree-hierarchy-type information which allow for the expression of one hierarchy
- Graph-type or Open-type (heterogeneous, arborescent): RDF, EAV , some XBRL application profiles, and other open schema-type or graph-type representations which are more graph-oriented and allow for dynamically creating virtually any number of hierarchies; very flexible
Basically, CSV was not designed to represent tree-type information, it was designed to represent table-type or tabular information. I am not going to go into explaining the differences between table, tree, and graph type data here, perhaps in another blog post.
Another limitation of the CSV syntax is that CSV does not define data types. By contrast, XML Schema defines data types (check out section 3 Built-in Data types) that can be used within some XML file. XML Schema data types are fast becoming the global standard data types, it seems.
Another limitation of the CSV syntax is that CSV does not really have much of a schema. Again, a relational database provides the ability to define a schema or the structure of and relations between tables in that relational database. XML Schema lets you define the structure that is allowed within an XML file.
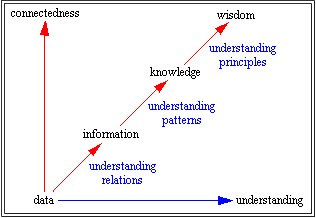
Another limitation of the CSV syntax is that CSV was designed to transfer data. There is a difference between data, information, knowledge, and wisdom. This is one explanation of the difference:
 by Gene Bellinger, Durval Castro, Anthony Mills
There is a subtle, but very significant, difference here. CSV stated that the objective is exchanging data between business and scientific applications. But the real goal is not the exchange of the data, but making use of the data: the real goal is business system interoperability.
So another way to cast this is that different technical syntaxes have differing powers of expressing semantics, or meaning, of the relations, patterns, and principles which are contained in the information. There are two reasons why you want to express this type of information: (1) verifying/validating that the information is expressed correctly, these are called business rules and (2) communicating to others as to the important relations, patterns, and principles represented within the information. The more business rules you have, the stronger the semantics. The stronger the semantics, the more you can do with the information.
Another point which can be made using CSV is the difference between a "presentation format" and a "representation format". CSV actually performs both presentation and representation functions well. It is easy for humans to read because it is tabular, but it is also easy for machines to consume because it is tabular. This is a good explanation of the difference between representation and presentation:
Presentation is just showing. Representation is showing with another meaning behind it. Representation is indicating something below the surface of what you’re presenting.
That is not the greatest explanation of the difference between presentation and representation, it will act as a placeholder for now.
I don't have this exactly where I want this but I am going to call this good and tune it up later.
 Charlie
in Becoming an XBRL Master Craftsman
|
Charlie
in Becoming an XBRL Master Craftsman
|
 Post a Comment
|
Post a Comment
|  Email
|
Email
|  Print
Print
Understanding Classification Systems
(This blog post relates to trying to sort out two very good graphs (graphic 1, graphic 2) for the purpose of creating a better graphic which includes XBRL and other things related to XBRL. The first step is to sort out all the terms used in the diagrams. This blog post focuses on classification systems.)
A classification system is a grouping of something based on some criteria. There are many different types of classification systems. David Wenberger's book Everything Is Miscellaneous points out two important things to remember about classification systems:
- That every classification scheme ever devised inherently reflects the biases of those that constructed the classification system.
- The role metadata plays in allowing you to create your own custom classification system so you can have the view of something that you want.
Everything is Miscellaneous also describes the three "orders of order" of classification systems:
- First order of order. Putting books on shelves is an example the first order of order.
- Second order of order. Creating a list of books on the shelves you have is an example of second order of order. This can be done on paper or it can be done in a database.
- Third order of order. Adding even more information to information is an example of third order of order. Using the book example, classifying books by genre, best sellers, featured books, bargin books, books which one of your friends has read; basically there are countless ways to organize something.
The following is a summary of terminology used to describe different types of classification systems on the two grapics pointed out above plus other items which seem to belong in the list of classification systems:
- List: A set of items or things.
- Dictionary: A dictionary is much like a list, a dictionary had no hierarchy.
- Glossary: A glossary contains explanations of concepts relevant to a certain field of study or action. In this sense, the term is related to the notion of ontology.
- Thesaurus: Lists grouped together according to similarity of meaning.
- Controlled vocabulary: Controlled vocabularies provide a way to organize knowledge for subsequent retrieval. They are used in subject indexing schemes, subject headings, thesauri, taxonomies and other forms of knowledge organization systems. Controlled vocabulary schemes mandate the use of predefined, authorised terms that have been preselected by the designer of the vocabulary, in contrast to natural language vocabularies, where there is no restriction on the vocabulary.
- Taxonomy: A taxonomy is a classification system which does have a hierarchy, but the hierarchy tends to be less formal.
- Folksonomy: A folksonomy is a system of classification derived from the practice and method of collaboratively creating and translating tags to annotate and categorize content; this practice is also known as collaborative tagging, social classification, social indexing, and social tagging.
- Ontology: An ontology is a set of well-defined concepts which describes a specific domain. Ontologies tend to be more formal, more complete, and more precise classification systems. The goal of an ontology is to provide a formal, machine readable, referancable set of concepts which are used in communications within a domain which precisely describes the domain. An ontology is also expressed as a hierarchy, but the hierarchy is more explicit and much richer in meaning than a taxonomy.
These things appear to be modeling systems which were somewhat intermingled with classification systems; they seem to be approaches to representing a classification system:
- Entity-relationship diagram (ER model): An entity–relationship model (ER model) is a data model for describing the data or information aspects of a business domain or its process requirements, in an abstract way that lends itself to ultimately being implemented in a database such as a relational database. The main components of ER models are entities (things) and the relationships that can exist among them.
- Conceptual model: A conceptual model is a model made of the composition of concepts, that thus exists only in the mind. Conceptual models are used to help us know, understand, or simulate the subject matter they represent.
- Concept map: A concept map is a diagram that depicts suggested relationships between concepts.
- Topic map: A topic map is a standard for the representation and interchange of knowledge, with an emphasis on the findability of information.
- UML (Unified Modeling Language): The Unified Modeling Language (UML) is a general-purpose modeling language in the field of software engineering to model systems. The basic level provides a set of graphic notation techniques to create visual models of object-oriented software-intensive systems. Higher levels cover process-oriented views of a system.
- XMI (XML Metadata Interchange): XML standard for exchanging metadata information.
All this stuff seems to fit into these general notions: (the big picture)
- Network theory: Network theory concerns itself with the study of graphs as a representation of relations between objects.
- Graph theory: Graph theory is the study of graphs, which are mathematical structures used to model pairwise relations between objects.
- Theory of relations: A relation in mathematics is defined as an object that has its existence as such within a definite context or setting.
Charlie
in Becoming an XBRL Master Craftsman
|
Post a Comment
| Email
| Print
Understanding Knowledge Modeling
Per MAKHFI.COM Knowledge Modeling is
the concept of representing information and the logic of putting it to use in a digitally reusable format for purpose of capturing, sharing and processing knowledge to simulate intelligence. Among others it can address business matters such as Agility, Compliance, Consistent Decisioning, Reasoning and Knowledge retention.
In the simple form, a Knowledge Model would be designed with the purpose of receiving data produced from various sources and generate outputs that could trigger actions.
I would point out the phrase "simulate intelligence". In terms of, say, financial reporting; the knowledge is in the form of what someone like a certified public accountant or external reporting manager knows about financial reporting. Or, the resources that they use in the process of external financial reporting such as the accounting standards codification, a disclosure checklist, and other such resources.
You can move this knowledge. Someone who as the knowledge can put it into the form that a machine can use and then the machine can tie all these resources together and the machine can help you create a financial report. The machine simulates the intelligence necessary to create a financial report by using the knowledge which was articulated in machine readable digital form.
You can check out that web site, lots of useful information. I will point out two very helpful things.
First, on the introduction page that site provides another explanation of the difference between data, information, knowledge, and wisdom (or they use intelligence).
- Data: The basic compound for Intelligence is data -- measures and representations of the world around us, presented as external signals and picked up by various sensory instruments and organs. Simplified: raw facts and numbers.
- Information: Information is produced by assigning meaning to data relevant to mental objects. Simplified: data in context.
- Knowledge: Knowledge is the subjective interpretation of Information and approach to act upon in the mind of perceiver. As such, knowledge is hard to conceive as an absolute definition in human terms.
- Wisdom (or Intelligence): Intelligence or wisdom embodies awareness, insight, moral judgments, and principles to construct new knowledge and improve upon existing ones.
They provide the following examples to help you understand the difference. DATA: The numbers 100 or 5, out of context; INFORMATION: Principal amount of money: $100, Interest rate: 5%; KNOWLEDGE: At the end of Year I get $105 back; INTELLIGENCE: Concept of growth.
Second, the web site categorized information into two distinguishable types:
- Explicit knowledge: Can be articulated into formal language, including grammatical statements (words and numbers), mathematical expressions, specifications, manuals, etc. Explicit knowledge can be readily transmitted to others. This type of knowledge can be easily "modeled" using various computer languages, decision trees and rule engines.
- Tacit knowledge: Personal knowledge embedded in individual experience and involves intangible factors, such as personal beliefs, perspective, and the value system. Tacit knowledge is hard (but not impossible) to articulate with formal language. Neural network offers the best possible method for modeling tacit knowledge.
Now, I would encourage you to go back and read this blog post: Digital Financial Reporting Will Change Accounting Work Practices. Read the part about how CAD software works. Project that into how digital financial reporting software will work. If you still don't get it, try this video: Digital Is Not Software, It Is a Mindset. Be sure to watch the part about the Amazon.com warehouse with "robot storage shelves that move around."
Charlie
in Becoming an XBRL Master Craftsman
|
Post a Comment
| Email
| Print
Understanding Digital Financial Reporting
The Louvre museum has an annual balance sheet of a State-owned farm, drawn-up by the scribe responsible for artisans: detailed account of raw materials and workdays for a basketry workshop. Clay, ca. 2040 BC (Ur III).
 Wiki commons
Paper-based (or clay-based) and even electronic PDF or HTML financial reports are readable by humans. On the other hand, digital financial reports are readable by both humans and machines.
Machines can therefore do things to help humans create or use digital financial reports that such machines could not help humans with before. This help from machines in creating and using the financial information within a financial report will reduce costs and increase quality. For example,
- A computer can read the reported financial information, understand the information, and can help make sure all of your mathematical computations are correct and intact; make sure everything foots and cross casts and otherwise ticks and ties.
- A computer can read the reported financial information, compare the reported information to disclosure rules, and make sure the creator followed mandated disclosure rules. This is somewhat like a manually created disclosure checklist is used today as a memory jogger.
- Reported information can be easily reconfigured, reformatted, and otherwise repurposed without the need to rekey information because a computer can do all this for you.
- Ambiguity is reduced for humans because for a computer to make use of the information, the information cannot be ambiguous. Making the information easy for a computer to correctly understand also makes it easier for humans to understand.
- Processes can be reliably automated because computers can reliably move information through the work process. Unlike trying to link spreadsheets together, linking digital financial information together can be much more reliable.
- Computer software can adapt itself to specific types of reporting scenarios, again because software leverages and understands the machine readable financial report information.
- Because processes can be automated, the time it takes to create financial reports will be reduced and the human costs of connecting processes can be reduced.
This is not to say that humans will not be involved in the process of creating financial reports. Clearly machines will never be able to exercise judgment. Computers cannot detect all possible mistakes, they can only help humans.
How can all this happen? The more a machine can understand (high semantic clarity), the more a machine can assist humans.
These resources can provide you with additional background information on the possibilities offered by digital financial reporting:
- Digital Isn't Software, It Is a Mindset
- How Data will Transform Business
- Project10X: The Power of Strong Semantics
- Semantics Overview
- Understanding Concept Computing
- Digital Financial Reporting will Change Accounting Work Practices
- Race Against The Machine: How The Digital Revolution Is Accelerating Innovation, Driving Productivity, and Irreversibly Transforming Employment and The Economy (MIT)
All we need to do is get the right software built which understands digital financial reports.
Charlie
in Becoming an XBRL Master Craftsman, Creating Investor Friendly SEC XBRL Filings
|
Post a Comment
| Email
| Print
TED: How Data Will Transform Business
Very interesting TED Talk. Philip Evans: How data will transform business.
Notice the number of times he uses the term "patterns".
Charlie
in General Information
|
Post a Comment
| Email
| Print

