BLOG: Digital Financial Reporting
This is a blog for information relating to digital financial reporting. This blog is basically my "lab notebook" for experimenting and learning about XBRL-based digital financial reporting. This is my brain storming platform. This is where I think out loud (i.e. publicly) about digital financial reporting. This information is for innovators and early adopters who are ushering in a new era of accounting, reporting, auditing, and analysis in a digital environment.
Much of the information contained in this blog is synthasized, summarized, condensed, better organized and articulated in my book XBRL for Dummies and in the chapters of Intelligent XBRL-based Digital Financial Reporting. If you have any questions, feel free to contact me.
Entries from November 1, 2015 - November 30, 2015
Comparing Reporting Styles, Notes on Comparability
Per SFAS 8 issued by the FASB, page 19, QC23:
"Comparability is not uniformity. For information to be comparable, like things must look alike and different things must look different. Comparability of financial information is not enhanced by making unlike things look alike any more than it is enhanced by making like things look different."
A form is uniformity. Financial statements are not forms. And while financial statements are not forms, they are likewise not random either.
I put together a little presentation about the comparability of financial reports for something and figured that I would share it. If you don't want to read through that entire presentation, I provide the cliff notes here in this blog post but the entire presentation is worth watching.
First, it is important to understand what the FASB means by "comparability (including consistency)". That is explained in SFAS 8 which is referenced above. Here is the pertinent section of that document: (from page 19). This is well stated, very clear, and every word is worth reading:
Comparability:
- QC20. Users' decisions involve choosing between alternatives, for example, selling or holding an investment, or investing in one reporting entity or another. Consequently, information about a reporting entity is more useful if it can be compared with similar information about other entities and with similar information about the same entity for another period or another date.
- QC21. Comparability is the qualitative characteristic that enables users to identify and understand similarities in, and differences among, items. Unlike the other qualitative characteristics, comparability does not relate to a single item. A comparison requires at least two items.
- QC22. Consistency, although related to comparability, is not the same. Consistency refers to the use of the same methods for the same items, either from period to period within a reporting entity or in a single period across entities. Comparability is the goal; consistency helps to achieve that goal.
- QC23. Comparability is not uniformity. For information to be comparable, like things must look alike and different things must look different. Comparability of financial information is not enhanced by making unlike things look alike any more than it is enhanced by making like things look different.
- QC24. Some degree of comparability is likely to be attained by satisfying the fundamental qualitative characteristics. A faithful representation of a relevant economic phenomenon should naturally possess some degree of comparability with a faithful representation of a similar relevant economic phenomenon by another reporting entity.
- QC25. Although a single economic phenomenon can be faithfully represented in multiple ways, permitting alternative accounting methods for the same economic phenomenon diminishes comparability.
US GAAP is an excellent financial reporting scheme because it strikes a good balance between the ability to compare and the ability accurately report the financial condition and financial position of an economic entity. When trying to implement "comparisons" in software, it is very important to understand the goal of comparability the financial reporting scheme enables.
The first key idea one needs to understand is the difference between a "concept" and a "preferred label for a concept". For example, if you see "Revenue" in a financial report, the reporting entity might mean "Operating revenue" or they might mean "Operating and nonoperating revenue" or perhaps even something else. So while the label might say "Revenue", the concept they are reporting could be "Operating revenue" or maybe "Nonoperating revenue". And the first step needed to understand the differences between concepts is to get a list of those concepts.
After that, you can look at how different reporting entities use those concepts. Theoretically, if you are working with one specific industry group and the economic entities in that industry group all use the same reporting style, then you CAN think of that specific set of financial reports as a "form". One of the most consistent reporting styles of public companies is that which is used by those that report using the "interest-based revenues" approach. i.e. banks.
If you go to this web page and grab the Excel spreadsheet with the link "Compare All Excel Code (ZIP)" and then run the algorithm (click the button), the algorithm goes and grabs the fundamental financial information from the balance sheet, income statement, cash flow statement, and statement of comprehensive income for 535 financial institutions that use an interest-based revenues style of reporting. (Takes about 15 minutes to get all that information).
The information is very consistent. For the 535 entities there are about 50 concepts. 535 times 50 equals a total of 26,750 facts that the Excel macro looks for. There are about 120 inconsistencies. 120 inconsistencies divided by 26,750 facts equals an inconsistency rate of .44% (less than 1%), or an accuracy rate of 99.55%. Not bad quality.
But what if you wanted to use that same Excel algorithm to analyze a regulated public utility. How good would that algorithm be? Not as good because the reporting styles of banks and regulated public utilities is different.
What if you created a different algorithm for regulated public utilities and ran that against companies that were regulated public utilities. The success rate would likely be better.
But then, what if you wanted to COMPARE a bank and a regulated public utility for some reason. How would that work? Well, you would have to map the reporting style of a regulated public utility to the reporting style of a bank that used interest-based revenues style of reporting. That requires judgement.
So what is the point? Here you go:
- Financial reports are not "uniform" or forms. But when you compare economic entities that use the same reporting style, you can treat the information more like a form.
- When you cross reporting styles, comparisons are possible but require judgement.
- If you want to see how to compare, all the moving pieces, go look at the code of that Excel spreadsheet I referenced above.
- Automating comparisons using machines such as computers takes metadata, you have to document the patterns and then explain those patterns to the software.
 Charlie
in Becoming an XBRL Master Craftsman, Demonstrations of Using XBRL
|
Charlie
in Becoming an XBRL Master Craftsman, Demonstrations of Using XBRL
|
 Post a Comment
|
Post a Comment
|  Email
|
Email
|  Print
Print
More and More Important Pieces are Falling Together
More and more important pieces are falling together. Remember, my background is accounting and not information technology or knowledge engineering. What I am realizing is that many technical people either don't know or cannot properly explain extremely important ideas which business professionals need to understand in order to make important decisions related to implementing a technology which they will then use.
For example, consider the notion of "decidability" which I have talked about before. That idea is linked to the notion of a Turing Machine. And that is linked to the notion of a Finite-State Machine. And that is linked to the Chomsky's Hierarchy of languages. (Here is a tutorial that explains this stuff.)
Make your head spin? Yeah, mine too. But my question is this: Why in the 16 years that I have been working to figure out and create XBRL and make it work for financial reporting with a bunch of world-class technical people did this stuff never come up? The closest to these sorts of important discussions what I remember getting is when we discussed the "closed world assumption" as contrast to the "open world assumption".
This is incredibly important stuff. Understanding these things is critical to making a system work correctly.
Why is this important? Here is an example. A financial report at any particular time has a "state". You can prove this by looking at a lot of financial reports, say 7000 financial reports given to the SEC, examine them, and you can see that, again as an example, they all are consistent with a set of fundamental accounting concept relations. Now, the 22 some relations that I am looking at is only for testing purposes. There are WAY, WAY more relations than that which exist in a financial report.
There are events that occur to an economic entity that creates a financial report: transactions, actions, circumstances, phenomenon, and other such events. And so that state changes. Kind of line an event driven finite state machine. Accounting systems track those changes in state.
Heretofore, accounting systems worked with data. But what if accounting systems worked with information? What if there were a Chomsky Type-3 language that could be used to provide information to an accounting system (not data that goes into a database) and finite-state automation could be achieved? What if the events are all perfectly tracked with that event driven finite state machine and then you wanted to report the next financial report for the economic entity?
Maybe your imagination will allow you to understand what I just said, maybe not. If you do understand, then it will now make a lot more sense why I have been reverse-engineering the financial disclosures, reporting styles, fundamental accounting concept relations, and other metadata related to financial reports.
Can a digital general purpose financial report be useful to the creators of the report, not just the users of the information? Well, first off; because there are so many details involved in creating a correct XBRL-based digital financial report for those that are required to create such reports and provide those reports to regulators, that is the only real practical way to create the XBRL-based reports that must be created today. So, that tool will exist. But the question is, can that application be compelling enough to use even when you don't need to press that "Save as XBRL..." button.
We shall see, because I am going to build that tool. Stay tuned.
Charlie
in Becoming an XBRL Master Craftsman
|
Post a Comment
| Email
| Print
Understanding US GAAP Reporting Styles
When you talk to most accountants you get the impression that US GAAP based financial reporting is random. Nothing could be further from the truth.
For example, how many public companies report balance sheets? The answer is that everypublic company reports a balance sheet, or more precicely a statement of financial position. What are the different styles that you can use to create a balance sheet? Well, since I looked at every balance sheet of every public company that reports to the SEC I can tell you:
- Classified balance sheetwhich breaks down assets and liabilities into their current and noncurrent portions. 5,343 public companies use that style.
- Unclassfied balance sheet which does not break outassets and liabilities into their current and noncurrent portions. 1,239 public companies use that style.
- Classified balance sheet alternative which is the same as the first style except that Noncurrent assets is broken down into "Fixed Assets" and "Other than Fixed Noncurrent Assets". There are about 88 public companies that use that style.
- Balance sheet that reports "Capitalization" which tends to be used by regulated public utilities.
- Liquidation basis statement of financial condition which is fairly rare and used by companies that are in the process of liquidating; also called a Statement of Net Assets. I don't have a precise count of this yet.
Do I have all of this 100% correct? Not yet. Are their other styles? Sure. But I am getting there. The same idea of reporting styles applies to the income statement, cash flow statement, statement of comprehensive income. I organized all this into what I am calling a Reporting Style Viewer (Prototype).
How helpful is organizing 100% of public company primary financial statement reporting styles to professional accountants? I contend that it is very helpful. It is helpful to me.
What about organizing all of the reporting styles for disclosures? Well, here is that also, I call it a Disclosure Library (Prototype).
Anyone else find this helpful?
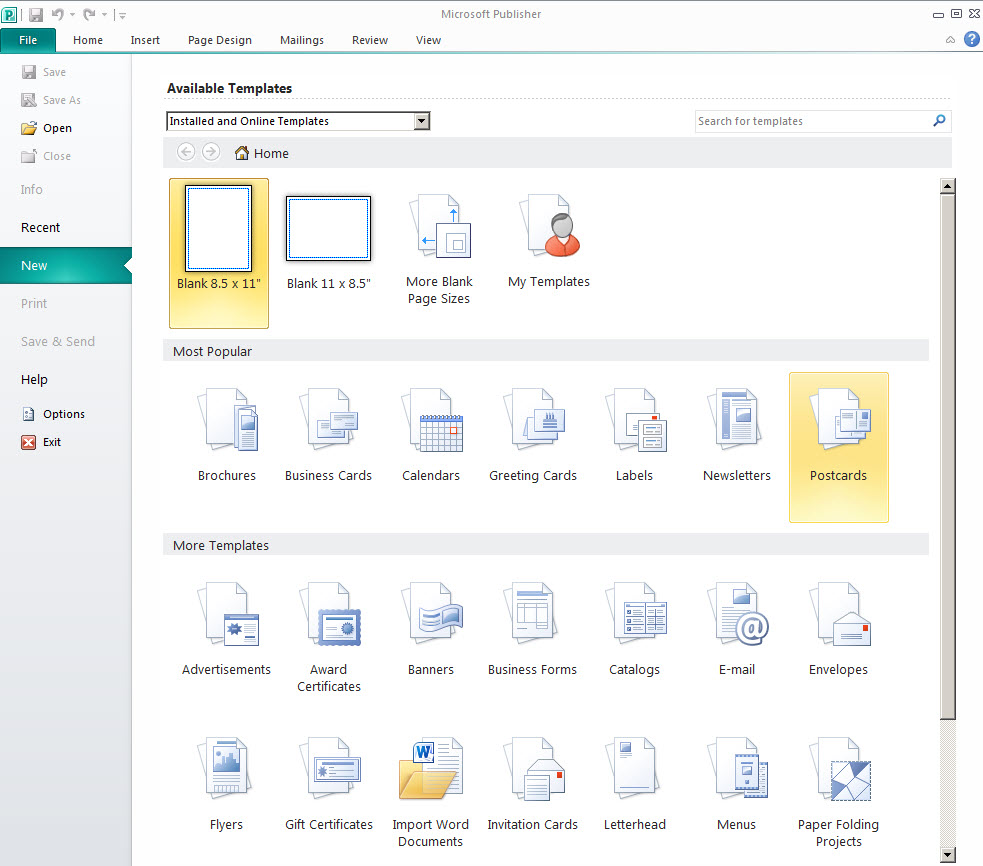
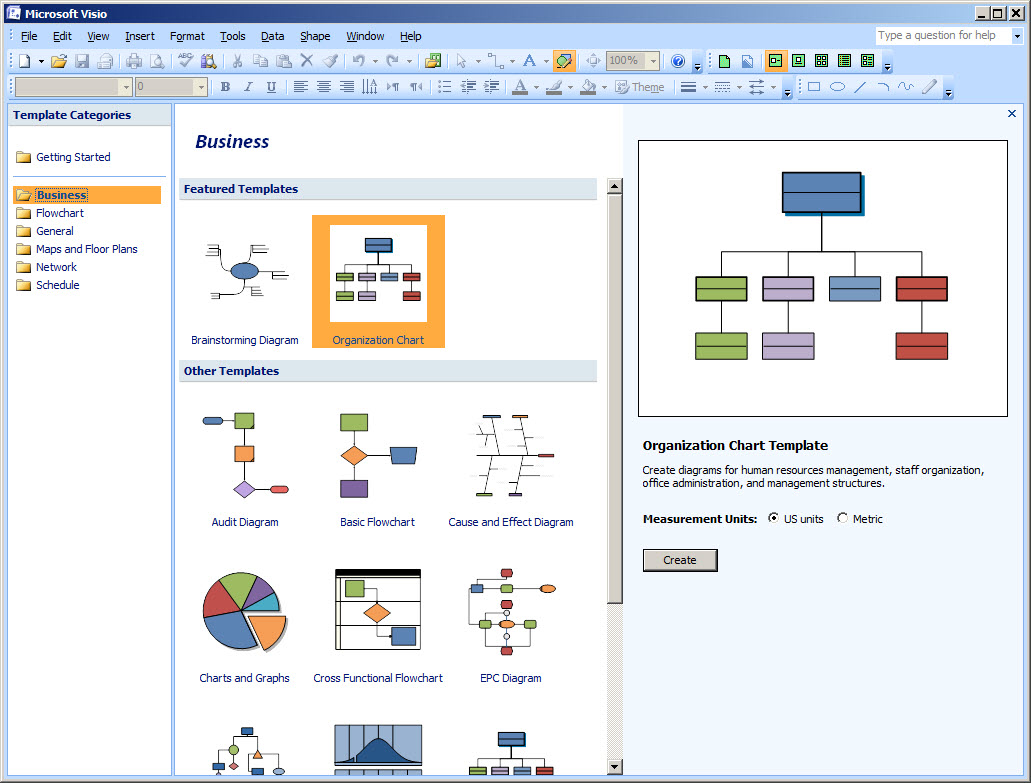
This organization is not really my idea. This is inspired by applications such as Microsoft Publisher and Microsoft Visio and many, many other software applications that have interface to work with selecting things. Here are screen shots for Publisher and Visio:
Publisher:
 (Click image for larger view)
Visio:
 (Click image for larger view)
How many accountants can point you to a list of every disclosure that exists? That is not the way accountants think about this stuff. But does that mean that you cannot create such a list? Or said another way, is there anything stopping someone from looking at every public company and reverse-engineering the complete list of disclosures? Why the heck would anyone go through the trouble to do that?
Well, why would anyone go through the trouble to organize Visio stencils?
When things are digital you get to think of things differently. Digital is not "software"; digital is a mindset. In the digital age, it helps to have a digital mindset.
If you have not read it already, you may want to go check out the document Understanding Blocks, Slots , Templates and Exemplars that I made available a while back.
Charlie
in Becoming an XBRL Master Craftsman, Digital Financial Reporting
|
Post a Comment
| Email
| Print

