BLOG: Digital Financial Reporting
This is a blog for information relating to digital financial reporting. This blog is basically my "lab notebook" for experimenting and learning about XBRL-based digital financial reporting. This is my brain storming platform. This is where I think out loud (i.e. publicly) about digital financial reporting. This information is for innovators and early adopters who are ushering in a new era of accounting, reporting, auditing, and analysis in a digital environment.
Much of the information contained in this blog is synthasized, summarized, condensed, better organized and articulated in my book XBRL for Dummies and in the chapters of Intelligent XBRL-based Digital Financial Reporting. If you have any questions, feel free to contact me.
Entries from February 5, 2012 - February 11, 2012
CompSci Taxonomy Search Tool
CompSci had made a free US GAAP Taxonomy search tool available which you can find here.
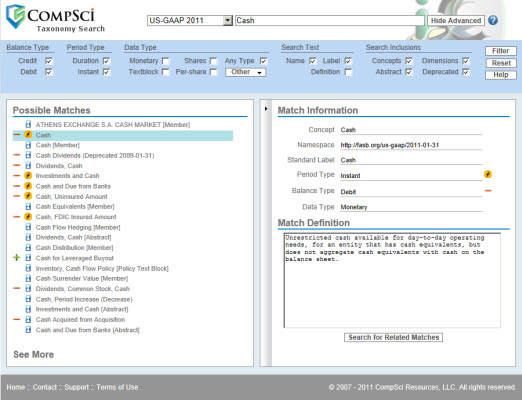
This search tool is a sign of things to come: better software!
One of the things I would like to see, which I will mention to CompSci is that I wish there was more of a focus on differentiating the types of report elements. What I mean is this. Take a look at this prototype I created a while back. Notice the report element categories I am using: Network, Table, Axis, Member, Line Items, Concept. Those terms are both consistent with the US GAAP Terminology and quite useful in differentiating what you are looking for.
Two interesting searches to try. Try and a search for Table. Just type the word Table, no brackets as that appears to goof up the search. Up comes all the tables in the US GAAP Taxonomy. Now, search on the term Roll Forward. All the roll fowards show up. Metadata such as [Table], [Axis], [Roll Forward], [Member], [Line Items] and such is helpful in finding information.
Now, what if you could search on accounting related metadata such as financial statement elements: assets, liabilities, equity, revenue, expense, gain, loss, investments by owners, distributions to owners, comprehensive income? How helpful would that be? Take this even farther and what if you could search by financial statement component such as "basis of presentation" and get all the components related to the basis of presentation? You cannot get that information today because all this search engine understands is the syntax elements and attributes. But, what if the search tool understood financial reporting and accounting semantics? Kind of like this which is a prototype which organizes [Table]s organized by accounting topic. Or maybe this which also shows the financial reporting component.
Nice job CompSci! Thanks for making this tool available.
 Charlie
in Demonstrations of Using XBRL
|
Charlie
in Demonstrations of Using XBRL
|
 Post a Comment
|
Post a Comment
|  Email
|
Email
|  Print
Print
Algorithms: Good or Bad, they are Part of Our World
Algorithms fly airplanes autonomously. Will all airplane pilots become obsolete one day? You can buy a $50 machine which will take your blood pressure, it runs on an algorithm. Will doctors become obsolete? Algorithms control trading on Wall Street. Will algorithms control the world?
When someone talks about computers controlling our world, the HAL 9000 from 2001: A Space Odyssey usually comes to mind, "Open the pod bay doors Hal."
In his TED talk, How Algorithms Shape our World, Kevin Slavin explains how algorithms impact our lives.
Algorithms can be expressed as computer software programs. Those computer programs can perform work. Algorithms are not good or bad, they are just software. They are a tool. Algorithms can be applied appropriately or inappropriately.
Thinking that algorithms will control the world is as absurd as believing that they will have no impact on our world at all.
As more and more things are expressed digitally, algorithms can do more and more. As additional metadata is added, algorithms can do even more.
Can an algorithm analyze a financial report? Can algorithms help create financial reports? Sure, they can do both. Not entirely, but they can help you create financial reports better, faster, and cheaper in many cases. Algorithms are just tools. The more you understand algorithms the better you will understand when they can be helpful and when they cannot.
Charlie
in Digital Financial Reporting, General Information
|
Post a Comment
| Email
| Print
Weave Open Source Analysis and Visualization Platform
Weave is web-based analysis and visualization environment. Per the Weave website:
Weave (BETA 1.0) is a new web-based visualization platform designed to enable visualization of any available data by anyone for any purpose. Weave is an application development platform supporting multiple levels of user proficiency – novice to advanced – as well as the ability to integrate, disseminate and visualize data at “nested” levels of geography.
There are three getting starting videos which gives you an idea as to how to use this visualization environment.
Charlie
in General Information
|
Post a Comment
| Email
| Print
Corning Video Shows where Digital Financial Reporting is Headed
This video provided by the manufacturer of Gorilla Glass, Corning, providing peek into what the future could be like with the growth of glass touch screen interfaces. From innovative chalk boards and activity tables in classrooms to uses for it in hospitals. Financial reporting is getting ready for this future!
Are you getting ready?
Charlie
in Demonstrations of Using XBRL
|
Post a Comment
| Email
| Print
Getting your Terminology Right
Precise terminology can be important. Using terms incorrectly inhibits communication.
The XBRL technical syntax includes not only XBRL terms defined by the XBRL Specification; but also terminology defined by XBRL Dimensions and XBRL Formula. Not only that, but because XBRL builds upon other technical specifications such as XML, XML Schema, XLink; you have that that technical terminology to contend with. How do you keep this all straight?
Well, most of this terminology will be hidden from users by software applications. Eventually.
I have put together a reconciliation of this terminology. This reconciliation maps XBRL and other technical terminology on the far right to financial reporting terminology on the far left. In between I have provided an example, Business Reporting Logical Model (BRLM) terminology which I have used in the past, and US GAAP/SEC financial filing terminology.
If implemented correctly, generating XBRL output from a software application does not have to be complicated by terminology which business users do not need to understand.
If you hear people using terms such as "tag" or "element" or "dimensionally qualified", they are making things harder than they really need to be.
A commonly misused term is "concept". Concept is a good term, if used in the right way. The terms "tag" and "element" could mean any of the building blocks used in an SEC XBRL financial filing: network, table, axis, member, line items, or concept.
The XBRL specification (section 1.4, terminology) does define the term "concept". A concept, per that definition is:
Concepts are defined in two equivalent ways. In a syntactic sense, a concept is an XML Schema element definition, defining the element to be in the item element substitution group or in the tuple element substitution group. At a semantic level, a concept is a definition of a kind of fact that can be reported about the activities or nature of a business activity.
Pretty hairy. But this gets even better. Tuples are not relevant because the US GAAP Taxonomy does not allow them, so basically, per this definition an XBRL concept is an XML Schema element which has a substitutionGroup attribute value of "xbrli:item". But there is a problem here.
The XBRL Dimensions specification (section 1.3, terminology) defines the terms hypercube (called a [Table] in the US GAAP Taxonomy) and dimension (called an [Axis] in the US GAAP Taxonomy). A hypercube is defined as an XBRL concept which has the substitutionGroup xbrldt:hypercubeItem and a dimension is defined as an XBRL concept which has the substitutionGroup xbrldt:dimensionItem. So, hypercubes and dimensions (or [Table]s and [Axis] using US GAAP Taxonomy/SEC terminology) are XBRL concepts; per the definition above they are "...kind of fact that can be reported...". Right?
No. XBRL Dimensions redefines the XBRL concept to mean Primary Item. So in essence, with XBRL Dimensions you get the major primitive building blocks of:
- Hypercube (or [Table] using US GAAP taxonomy/SEC terms)
- Dimension (or [Axis] using US GAAP taxonomy/SEC terms)
- Primary Item (or [Line Items] using US GAAP taxonomy/SEC terms)
- Domain Member (or [Member] using US GAAP taxonomy/SEC terms)
So, when most people use the term "concept" they are referring to a "kind of fact that can be reported about the activities or nature of a business activity", not a hypercube, dimension, or domain member.
Three primary take aways here:
- These different cagetories of rudimentary or primitive building blocks do exist, terms like "element" and "tag" are not appropriate.
- Use the proper term.
- While there is no "global standard" set of terms; you can use the terms I propose create your own set of terms; or help push for one standard global standard set of terms.
Personally, I have pushed for that global standard set of terms for quite some time. That logical model will be very useful to both business users and software vendors who are trying to create quality software.
Do you have a better terminology scheme? If you do I would like to hear about it both to improve mine and pass this information on to XBRL International. Let me know.
Charlie
in Digital Financial Reporting, Modeling Business Information Using XBRL
|
Post a Comment
| Email
| Print

