BLOG: Digital Financial Reporting
This is a blog for information relating to digital financial reporting. This blog is basically my "lab notebook" for experimenting and learning about XBRL-based digital financial reporting. This is my brain storming platform. This is where I think out loud (i.e. publicly) about digital financial reporting. This information is for innovators and early adopters who are ushering in a new era of accounting, reporting, auditing, and analysis in a digital environment.
Much of the information contained in this blog is synthasized, summarized, condensed, better organized and articulated in my book XBRL for Dummies and in the chapters of Intelligent XBRL-based Digital Financial Reporting. If you have any questions, feel free to contact me.
Entries from March 29, 2015 - April 4, 2015
Others use "Ontology" and "Accounting" or "Business" in Same Sentence
I use the term financial report ontology. But, it is not only me who uses the term "ontology" together with the term "accounting" or "business" or "financial report". Here are others:
- Richard Mattessich, University of British Columbia - Department of Accounting, wrote the book Reality and Accounting: Ontological Explorations in the Economic and Social Sciences (Routledge New Works in Accounting History).
- The paper written by Marthinus Cornelius Gerber, Aurona Jacoba Gerber, Alta van der Merwe, An analysis of fundamental concepts in the conceptual framework using ontology technologies, explains how ontologies can be used to make financial reporting standards less vague, inconsistent, logically incoherent, and otherwise ambiguous.
- The acccounting ontology was created in a revised version of the paper above.
- Alexander OSTERWALDER, wrote THE BUSINESS MODEL ONTOLOGY, A PROPOSITION IN A DESIGN SCIENCE APPROACH, in 2004.
- Then there is the Financial Industry Business Ontology (FIBO) which is being created by OMG.
- Marcus Spies did a presentation in 2007, An ontology modelling perspective on business reporting languages
- Here you have some folks creating a government bugeting ontology.
"Digital" is not software, it is a mindset.
If you want to understand ontologies and ontology design, the Basic Formal Ontology (BFO) provides a lot of very useful information.
 Charlie
in Becoming an XBRL Master Craftsman, Digital Financial Reporting
|
Charlie
in Becoming an XBRL Master Craftsman, Digital Financial Reporting
|
 Post a Comment
|
Post a Comment
|  Email
|
Email
|  Print
Print
Public Company XBRL Quality Increases Significantly
The quality of public company XBRL-based digital financial reports continues to increase. There are two significant trends. First, between 2013 and 2014 overall consistency with all the rules in a set of 21 fundamental accounting concept relationship rules grew to 58.3% from the comparable overall consistency of 25.6% a year ago.
The second trend is that you can see an increasing spread between the quality levels between generators, the software vendors and filing agents which are used to create these XBRL-based digital financial reports. Here is a summary of the current results (for 2014 10-K filings):
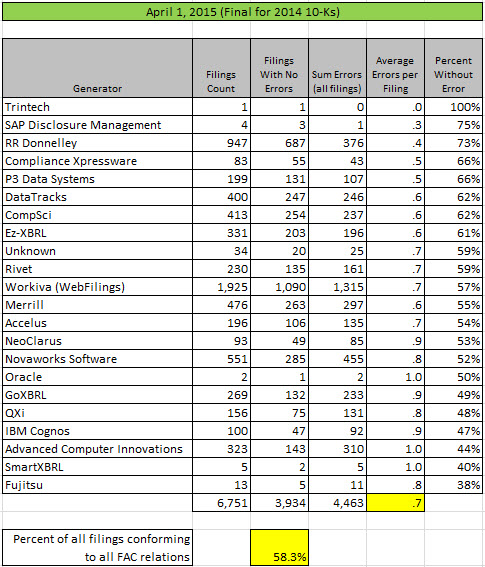 (Click image for a larger view)
Here is comparible information for 2013 public company 10-Ks:
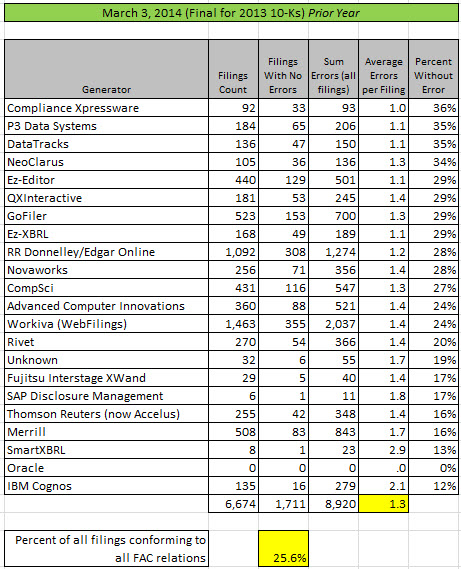 (Click image for larger view)
So look at the differences in the percentages of generators (software vendors/filing agents) in being consistent with these 22 fundamental accounting concept relations. Ask yourself a question: Why would there be a difference between consistency with those relations by generator? Something to think about.
There are three reasons why these numbers change:
- Correction of filing errors in the reports of public companies which are not consistent with the specified rules.
- Correction of rule errors in the fundamental accounting concept relation rules and therefore in the verification check results.
- Correction of US GAAP XBRL Taxonomy errors which can make it impossible for public companies to represent their report information consistent with the relation rules because of missing concepts.
All of the rules which are used to specify the fundamental accounting concept relations can be found here in the report frames (report pallets) which express the fundamental accounting concept relations.
The following is a summary of the consistency of public company XBRL-based digital financial reports to the fundamental accounting concept relations for each relation. As can be seen in the data, public companies financial reports are over 90% consistent with every relation and 95% consistent with all but 5 relations. Average consistency to these relations is 96.9%.
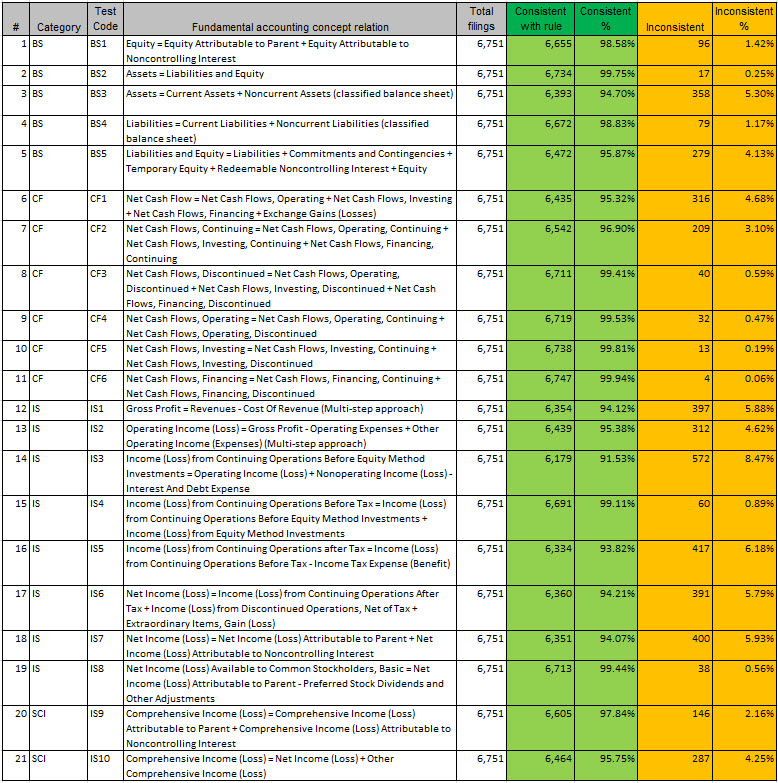 (Click for larger image)
One very significant change between the prior year and the current year is that the current 2014 information comes from off-the-shelf commercial software which is available. In 2013, the software was not commercially available.
More details will be provided in the near future. (Here are those details.)
Charlie
in Becoming an XBRL Master Craftsman
|
Post a Comment
| Email
| Print
Seeing the Digital Financial Report Model Using SECXBRL.info
The links on this blog post will work until April 30, 2015. At that time they will expire.
This blog post walks you thought the digital financial report model using SECXBRL.info web service. 28msec has kindly allowed me to show this information uisng their commercially available web service API. A token is provided within these links which makes this information publicly available. The token will expire April 30, 2015. Information is provided in four formats: HTML, XML, CSV, and JSON.
The web service is an SEC specific profile (note "profile-name=sec" in the URL) of a general business report. This web service API provides information for public companies that report financial information to the SEC using the XBRL format.
This describes the model of a general business report using financial statements which are a type of business report.
Economic entities create financial reports. (The list is the Fortune 100 companies which are used as an example. The SEC has about 6500 public companies which follow this model.). Here is the same list in XML, CSV, and JSON.
Reports are created by an economic entity. (This shows all the reports submitted to the SEC by 3M.) Here is the same information in XML, CSV, and JSON.
Reports can be broken down into components or report fragments. (This shows the components of the last 10-K provided to the SEC by 3M.) Here is the same information in XML, CSV, and JSON. Note that every component that is listed is identified by a network and a hypercube (table).
A component has a fact table. (This shows the fact table for the first component of the last 10-K of 3M.) Here is the fact table in XML, CSV, and JSON.
A component has a model structure (or report structure). (This shows the model structure of the same component as the fact table above. This is not a particularly good HTML representation.) Here is the model structure in XML, CSV, and JSON.
A component has a renderingwhich is created using the fact table, the model structure, and information about the concept arrangement pattern of the component and the member arrangement patterns of the component. The rendering information is not provided in XML, CSV or JSON.
That is essentially a high-level model of a digital financial report, the foundation of every digital financial report. The document Understanding the Mechanics of a Digital Financial Report explains additional details about this model. The document Knowledge Engineering 101 for Business Professionals explains other considerations. Other semantics build on those base semantics.
The document Understanding the Mechanics of an SEC-type XBRL-based Digital Financial Report summarizes this model specifically for an SEC-type digital financial report, which is a type of financial report, and therefore a type of business report. The document also shows that the XBRL-based public company financial reports submitted to the SEC all fit into this model. This is empirical evidence which supports this model.
Charlie
in Becoming an XBRL Master Craftsman
|
Post a Comment
| Email
| Print
XBRL International Guidance Clarifies XBRL Dimensions Semantics
XBRL International provided a document, Technical Considerations for Use of XBRL Dimensions 1.0, which clarifies semantics carried by information expressed using XBRL Dimensions. The document is worth reading but here are the highlights:
- <segment> and <scenario> elements carry no meaning: Where you put XBRL Dimensions information has no semantics. Whether you use the <segment> element of the context or the <scenario> element; the meaning is the same. XBRL International recommends using either <segment> or <scenario>; for new taxonomies they recommend using <scenario>.
- Always close hypercubes: All hypercubes (positive) should be closed. Don't use negative hypercubes without an associated positive hypercube.
- Don't mix dimensional and nondimensional models: The statement (Recommendation 3.5), "Where a taxonomy makes use of dimensions, all concepts should be associated with at least one hypercube, even if that hypercube has no associated dimensions." basically means don't mix a dimensional model and a nondimensional model.
- Dimension defaults are used to represent a total: The statement (Recommendation 5.1) "Dimension defaults should only be used to specify a member which is the natural total for a domain." basically means that dimension defaults convey information about a total.
- Don't use complex typed dimensions: The statement (Recommendation 6.1) "Typed dimensions should only use XML Schema simple types as their data type." basically means don't use complex typed dimensions, use only simple typed dimensions only.
The US GAAP XBRL Taxonomy currently violates two of these recommendations.
The US GAAP XBRL Taxonomy mixes dimensional and nondimensional models. Not every concept belongs to a [Table] (which is the US GAAP XBRL Taxonomy name for hypercube). But that does not mean that public companies creating XBRL-based financial filings cannot conform to this XBRL International recommendation. In fact, some public companies already do this. Come public companies always represent their information associating all reported facts to a [Table].
The US GAAP XBRL Taxonomy also does not use dimension defaults per the XBRL International recommendations. Many times dimension defaults are used to convey information which is not a total. Also, many people think that dimensions defaults are about "defaults". They are not. They are about intersections between two or more different [Table]s or hypercubes. Generally one hypercube is summary and the other hypercube is a breakdown of that total.
Charlie
in Becoming an XBRL Master Craftsman
|
Post a Comment
| Email
| Print

