BLOG: Digital Financial Reporting
This is a blog for information relating to digital financial reporting. This blog is basically my "lab notebook" for experimenting and learning about XBRL-based digital financial reporting. This is my brain storming platform. This is where I think out loud (i.e. publicly) about digital financial reporting. This information is for innovators and early adopters who are ushering in a new era of accounting, reporting, auditing, and analysis in a digital environment.
Much of the information contained in this blog is synthasized, summarized, condensed, better organized and articulated in my book XBRL for Dummies and in the chapters of Intelligent XBRL-based Digital Financial Reporting. If you have any questions, feel free to contact me.
Entries from April 12, 2015 - April 18, 2015
Tao of Digital Financial Reporting
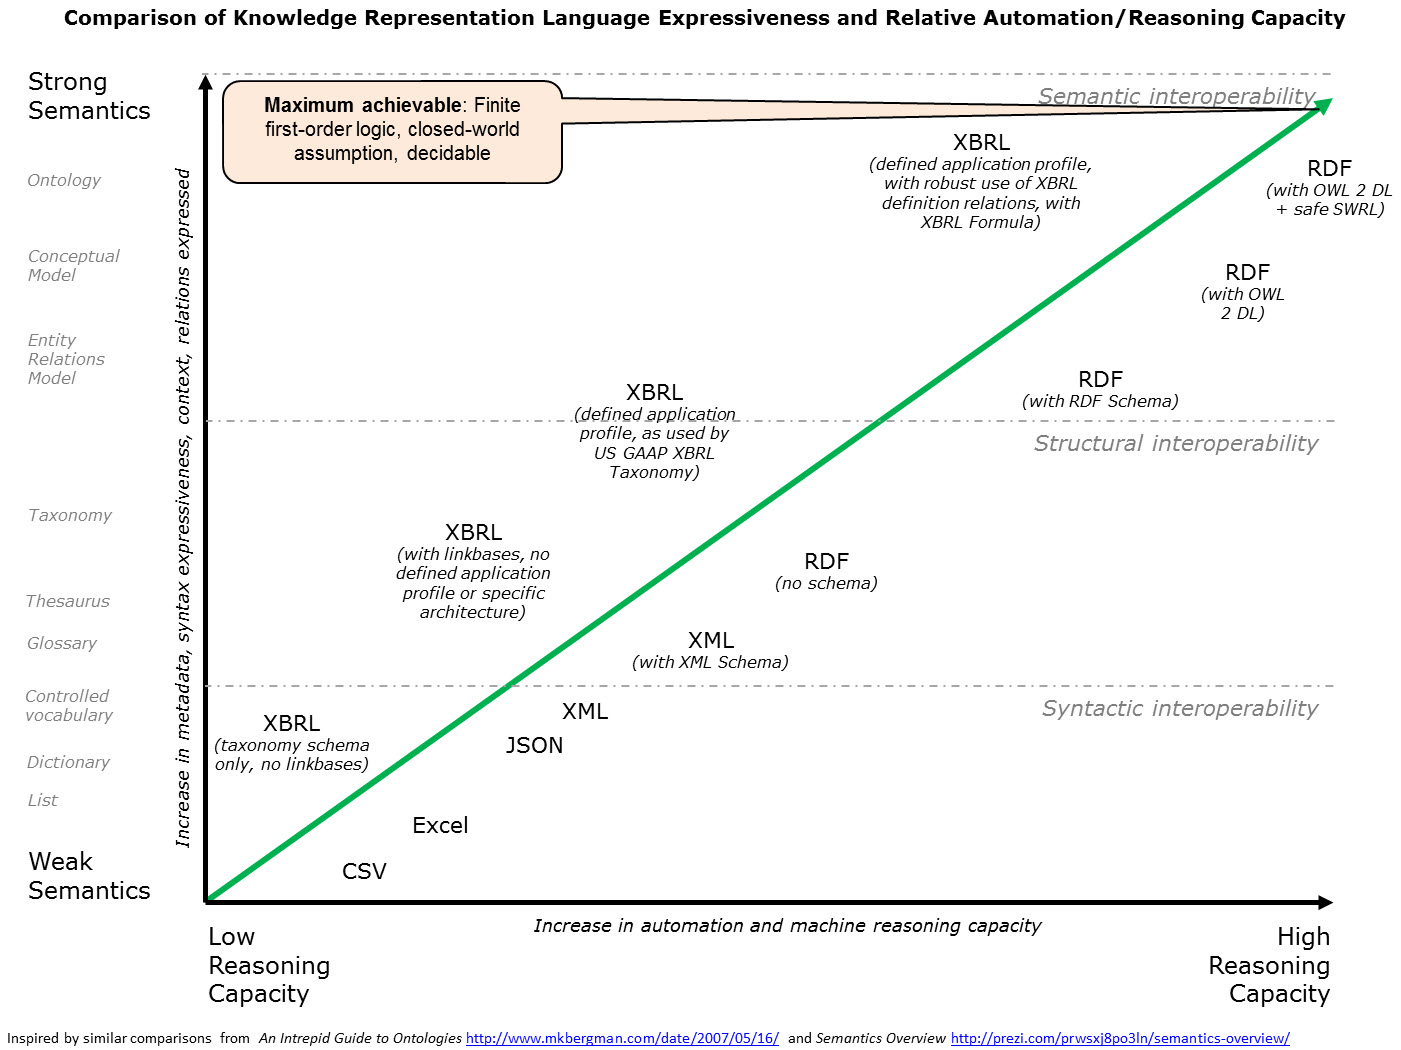
Things are getting clearer and clearer. I have had the graphic below which compares the expressive power of different technical syntax. The expressive power of a technical syntax is important because to the extent that some machine-readable technical syntax can be used to describe some problem domain; it is to that same extent that the machine-readable technical syntax can confirm consistency with that problem domain.
To say this another way: description of the problem domain and verification that things expressed are consistent with the description of that problem domain are two sides of the same coin. This may not seem important until you remember that:
The only way a meaningful exchange of information can occur is the prior existence of agreed upon technical syntax rules, business domain semantics rules, and workflow/process rules.
 (Click image for larger view)
So one of the aspects I have been confused about is what is shown in this second graphic below. The outer circle represents two ideas: (a) All the "things" and "relations between things" that need to be expressed so that digital financial reporting can work effectively; (b) the fact that some of the "things" and "relations between things" need to interact with other machine-readable problem domains. Basically, the outer circle represents the theoretically possible goal of what is required.
But machines, such as computers, that humans build are never perfect. You are limited by the available technology which can be used to build the tool. The next circle represents what is currently available as the most powerful and appropriate tool for expressing the "things and relations between things" expressible by the tool finite first-order logic.
Now, this is still a little bit confusing to me. I am not exactly sure what term I should be using here. I use finite first-order logic, as contrast to infinite first-order logic for a specific reason. "Infinite" systems cannot be expressed and they tend to not work predictably and they can have unforeseen blowups. That is not desirable.
What is desirable is a system that is safe, predictable, reliable, repeatable and therefore a dependable tool. Someone described this as "expressive power must be useful-yet-harmless". Another important thing is that we need maximum expressivity (that goes furthest towards meeting our data-collection needs) without sacrificing the quality referred to as decidability. The system must be "decidable".
While I used the term finite first-order logic I have heard others use terms such as: Description Logic which seems to be a subset of first-order logic; mathematical model or model theory; predicate logic; propositional calculus; and for good measure I will throw in simply logic. I see all of these things as being more similar than being different. The key here is that you can describe the real world by creating a theory, expressing that theory using a set of logical axioms, and you can prove that theory using formal logic.
Ultimately, anything that is created to express the "things and relations between things" of a problem domain must be put into machine-readable form. That requires a syntax that a machine can read. If you go back to the first graphic, you see two technical syntaxes at the top of the list: XBRL and RDF/OWL.
I have tried and tried to get both XBRL and RDF/OWL to express 100% of what is needed to be expressed for the problem domain of financial reporting. Each technical syntax has a set of pros and cons. Each technical syntax is capable of expressing 100% of what would need to be expressed, it seems. However, neither expresses 100% of what is needed right now. Does one syntax have an advantage over the other currently? Well, because XBRL supports dimensions and mathematical computations and OWL does not; I would give XBRL an advantage. Or said another way, the "path" to what is necessary seems shortest using XBRL rather than RDF/OWL.
 (Click image for larger view)
The bottom line: Frankly, I really cannot tell which technical syntax is the best syntax. What I can say is that since XBRL-based financial filings is what is required by the SEC right now, one must eventually get the information into that syntax.
In terms of expressing the "things" and the "relations between the things", I find the document Ontology for the Twenty First Century: An Introduction with Recommendations hands down the most comprehensive resource for explaining that. That document is organized nicely into "layers" that you can work through. Most business professionals will never be able to understand that information in the manner that it is articulated in that document. What will happen is that the important pieces will be combined into a set of building blocks, encapsulated within significantly easier to use software, and then business professionals will use that software.
This is a bit of a leap, but there are three examples of easy to use software which shows the possibilities:
- Blockly: Many people might not get what I am saying, but think "Legos".
- Scratch: Again, that is a bit abstract but keep "Legos" in your mind and watch the video in the upper right hand corner.
- Quantrix: Watch as many videos that you can, but don't miss the Quantrix Key Concepts video.
And this document describes those "Lego" blocks. Some accounting professionals need to understand basic knowledge engineering principles. They will help software vendors build the right tools.
It is becoming increasingly obvious that the way to simple, elegant, and easy to use digital financial reporting is a clear, consistent, logically coherent, rigorous, and well-thought-out formal description of the things and relations between things to the extent that they can be described by finite first-order logic. Most of what is necessary to express these things and relations between things is already available. Proof of that is my ability to detect inconsistencies with the descriptions that I created. The pieces which make up digital financial reporting must be created with high intension, specific conscious effort, well-thought-out direction, making specific conscious choices, and skillful execution by professionals with resolve to achieve that goal.
But I am just one certified public accountant from Tacoma, Washington. It will take collaboration and cooperation to build the control mechanisms necessary to get all public companies, financial analysts, software vendors, filing agents, the FASB, the SEC, data aggregators, and others in the financial reporting supply chain completely on the same page. Once digital financial reporting works for public companies, then private companies might start looking at XBRL-based digital financial reporting.
I do know that financial reporting is leading the way to the vision of what many people refer to as the semantic web. Digital is the future. It is getting increasingly risky for accounting professionals who do not recognize this.
 Charlie
in Becoming an XBRL Master Craftsman
|
Charlie
in Becoming an XBRL Master Craftsman
|
 Post a Comment
|
Post a Comment
|  Email
|
Email
|  Print
Print
Improved Fundamental Accounting Concept Analysis Prototype
Programming is so much fun! I showed an analysis tool prototype in another blog post. That was created by copying and pasting data from my database into Excel.
Here is an improved version of that prototype.
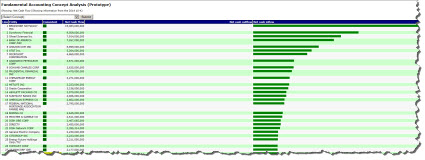
That is still a working prototype. It is still rather rudimentary. Rather than going across the page, this goes down the page so that it is easier to see the information for each entity. I am showing all 6,751 entities in my set of 2014 10-Ks.
This does not work yet, but I put a combo box on the form to let the user of the form select any of the fundamental accounting concepts. I think I am also going to add the 35 financial ratios that I can get from Table 3 of the financial statement fraud prevention and detection paper.
Take a look at the chart. It is no wonder Warren Buffett has so much money. BERKSHIRE HATHAWAY INC. has net cash flow that far exceeds the second best public company. Scroll to the bottom and you see VERIZON COMMUNICATIONS INC at the bottom of the list. (Note that you can click on the Line number and go to the SEC filing page.)
Note the column "Consistent". If the information was consistent with other information (i.e. the fundamental accounting concept relations of the report were consistent), there is a green OK in that column. If the information is inconsistent, there is a yellow INCONSISTENT. For that specific reported fact, there are 316 out of the total 6,751 entities that provided information which is nonsense. By "nonsense" I mean the information is inconsistent with other information or the reported fact could not be located at all.
I find it amazing that it is now so easy to query every financial report in the EDGAR system. All we need now is to keep improving information quality.

