BLOG: Digital Financial Reporting
This is a blog for information relating to digital financial reporting. This blog is basically my "lab notebook" for experimenting and learning about XBRL-based digital financial reporting. This is my brain storming platform. This is where I think out loud (i.e. publicly) about digital financial reporting. This information is for innovators and early adopters who are ushering in a new era of accounting, reporting, auditing, and analysis in a digital environment.
Much of the information contained in this blog is synthasized, summarized, condensed, better organized and articulated in my book XBRL for Dummies and in the chapters of Intelligent XBRL-based Digital Financial Reporting. If you have any questions, feel free to contact me.
Entries from July 11, 2021 - July 17, 2021
Standard Thesaurus for Financial Accounting, Reporting, Auditing, and Analysis
I was reading through The Knowledge Graph Cookbook: Recipes that Work (which mentions XBRL on page 108) and that book mentioned the STW Thesaurus for Economics. That resource is managed under the umbrella of the International Society of Knowledge Organization (ISKO). You can have a look at the machine-readable and human-readable of the Thesaurus for Economics here. Also, you might want to have a look at the Finaicial Industry Business Ontology (FIBO).
Folks, what needs to exist is an industry managed Standard Thesaurus for Financial Accounting, Reporting, Auditing, and Analysis! Professional knowledge engineers need to be engaged to help create this. Accountants need to learn how to effectively communicate with knowledge engineers.
This information would provide a good starting point:
The institution of accountancy really needs to stop messing around and get with the program. This should not be an academic exercise, it should be an industry driven initiative. We should start with US GAAP and IFRS, but also consider other financial reporting schemes. This initiative should not be driven by standards setters and regulators. Yes, they should play a part but they should just be one of the groups around the table.
The root of the knowledge graph is the double entry accounting model, the accounting equation, and the fundamental accounting concepts.
That standard thesaurus can be used to construct things like the accounting oracle.
Anyone interested in participating please contact me.
 Charlie
in Digital Financial Reporting, Knowledge Graphs
|
Charlie
in Digital Financial Reporting, Knowledge Graphs
|
 Post a Comment
|
Post a Comment
|  Email
|
Email
|  Print
Print
Improving the Semantic Hygiene of the Language of Business
Warren Buffett is credited with coining the phrase, "Accounting is the language of business." But as the Corporate Finance Institue points out, there are actually three languages of business: accounting, finance, and economics.
As is pointed out in the article by George Doris, KORZYBSKI AND GENERAL SEMANTICS*, communications is hard. It is not the "traps in language" that cause communications problems, rather it is our ignorance of those traps that cause communications problems.
I am an accountant so I will stick with accounting. I will use the example of the general purpose financial report whose purpose is to communicate the financial status and financial performance of an economic entity as an example.
The article states the following:
Certain very important relationships are illustrated by the analogy:
We have been considering some of the problems arising from distorted relationships between ‘maps’ and ‘territories’. Yet the potential for error does not stop there – the relationship between the map and the mapmaker is important, and the latter may bring other distortions in creating his or her ‘meaning’, especially in interpersonal communication.”
- Just as the map is not the territory, the word is not the thing.
- Just as the map cannot represent all of the territory, words cannot say all about anything.
- Just as we can make a map of a map, we can make a statement about a statement, and use words about words.
A general purpose financial report is not the economic entity itself. If the language used to describe the financial status and financial performance of the economic entity does not have good "semantic hygiene" that makes effective communications harder or even impossible.
At its essence, accounting is a mathematical model. Yes, financial accounting and reporting can be complex. Can that communication, the language of business, be digitized? Sure it can, if the digitization is done correctly. Computers are like babies. Not like a child, like a baby. A computer needs to be led by the hand using machine readable rules. Those sentences and assertions can be articulated in the form of a knowledge graph. But if the rules are not clear because the language of accounting and reporting is not clear, the results will be less than satisfying.
It is time that the semantic hygiene of accounting, reporting, auditing, and analysis to be improved. First steps have been taken. Things like accounting oracles will be built. But all these incredibly useful tools will only be as good as the language that provides the underpinnings, the foundation, the keystones.
One final thing that article points out. “We live in a world of process, change and dynamic structure, yet we map it with static words.” Folks, there are many other approaches. Artificial intelligence is real, but if the semantic hygiene is not improved mistakes will be made.
###########################
Charlie
in Digital Financial Reporting, Knowledge Graphs
|
Post a Comment
| Email
| Print
Knowledge Graph of Microsoft 10-K Financial Report
The Microsoft 2017 10-K XBRL-based financial report is one of the XBRL-based financial statements that I have analyzed very, very heavily. Why? Because it is good and because it is big. This blog post provides additional details about that financial report which accountants might very well find interesting. What I have done is apply my method to the Microsoft XBRL-based financial report retrospectively.
These details are becoming quite easy to show and communicate using the Pacioli Power User Tool. Using that tool and running this script: (chick here)
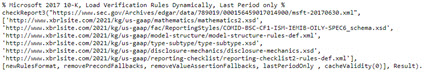
You get the following report analysis package. (note that this link is permanent and that the verification report was run on February 23, 2022.) Here is documentation for working with this using Pacioli and Pesseract.
To generate that analysis package, I supplemented the Microsoft base report model (i.e. XBRL taxonomy) and report (i.e. XBRL instance) with some additional information. That additional information includes:
- Additional mathematical relations: Microsoft is not required to and is, in fact, not allowed to submit mathematical relations information beyond what can be articulated using XBRL calculation relations. I supplemented that information with 45 value assertions using XBRL formula to test mathematical relations which beyond the capabilities of XBRL calculation relations which only verifies roll up relations.
- Fundamental accounting concept relations continuity cross checks: Neither the SEC, the FASB, nor Microsoft provides rules that verify that the XBRL-based financial report is consistent with fundamental accounting relationships such as "Assets = Liabilities + Equity". See here, lines 10 through 30 for that information.
- Derivation of unreported high-level accounting facts: Did you know that Microsoft does not explicitly report the line item "noncurrent assets" or "noncurrent liabilities"? The fact of the matter is that there are 19 high-level financial reporting concepts that Microsoft does not explicitly report. Now, Microsoft is not required to report that specific information, but analyzing their financial report is hard without understanding that fundamental information. My analysis derives those 19 unreported high-level financial reporting line items.
- Report model structure checks: Did you know that neither XBRL International, the FASB, the SEC do not specify the proper relations between the types of report elements that make up the model of an XBRL-based financial report? Well, I did and then I verified that the Microsoft finacial report follows only what is permitted.
- Type-subtype relations checks (a.k.a. Parts and Wholes): Did you know that while the SEC does specify that a reporting entity should "use the narrowest concept" per some set of wider-narrower associations; but they do not specify those fundamental wider-narrower relations in machine readable for or, for that matter, in any form really. So I documented some of those relations to test out how Microsoft is doing and then verified Microsoft's report against those relations. (This is another graphical version of that same information, but this needs some work.)
- Disclosure mechanics checks: Did you know that neither the FASB nor the SEC actually specifies what each disclosure is permitted to look like? Not every detail of every disclosure, I am just talking about the essence of the disclosure. Sure, different economic entities will have different line items, subtotals, and other such information. But the essence of the disclosure is the same for each specific disclosure. I specified these rules for 121 (about 94.5%) of all the Microsoft financial disclosures and then verified that Microsoft is following what is permitted.
- Reporting checklist: Did you know that neither the FASB nor the SEC specifies, in machine readable form, a checklist that indicates which disclosures are required and when they are required? Well I did that for 128 possible disclosures which covers about 94% of the 121 different disclosures provided by Microsoft. And then I verified that the Microsoft report was consistent with what is permitted.
- Blocks of Information: Did you know that "networks" (defined by XBRL) are arbitrary groupings of information? Did you know that "hypercubes" (defined by XBRL) are likewise arbitrary groupings of information. A reporting entity can organize information many different ways within networks and/or many different ways using hypercubes within a network. But did you know that I was able to identify 192 units of information within the Microsoft XBRL-based financial report? Those "blocks" are not arbitrary and not dependent on networks or hypercubes. This same "block" mechanism works for all XBRL-based financial reports submitted to the SEC. A block is simply a set of information that has a basket of specific characteristics.
- Blocks Graph: Did you know that information in a financial report tends to be related to other information in a report in many cases? Of course you did. But, can you visualize that information and use that visualization to navigate between those report fragments? Well, because we are using a high-level report model we can create that visualization. (Granted, this is a bit rough right now, but you might get the idea.)
All of this additional stuff I have added to the Microsoft 10-K articulates information about the report (describes the report) and also can be used to verify that the report itself is consistent with that description of what is permitted.
If you are not familiar with knowledge graphs, I would highly recommend The Knowledge Graph Cookbook: Recipes that Work. The resource Financial Report Knowledge Graphs will help you understand this information specifically for financial reports.
Finally, think about something. How would you KNOW with certainty that the set of rules you are providing to verify a financial report is COMPLETE? Think about that. If you are creating a "true and fair" representation of a financial report in machine readable for, this is important to get right. If you want to understand how to do that, have a good look at the Seattle Method.
Charlie
in Digital Financial Reporting, Knowledge Graphs
|
Post a Comment
| Email
| Print

