BLOG: Digital Financial Reporting
This is a blog for information relating to digital financial reporting. This blog is basically my "lab notebook" for experimenting and learning about XBRL-based digital financial reporting. This is my brain storming platform. This is where I think out loud (i.e. publicly) about digital financial reporting. This information is for innovators and early adopters who are ushering in a new era of accounting, reporting, auditing, and analysis in a digital environment.
Much of the information contained in this blog is synthasized, summarized, condensed, better organized and articulated in my book XBRL for Dummies and in the chapters of Intelligent XBRL-based Digital Financial Reporting. If you have any questions, feel free to contact me.
Entries from September 26, 2021 - October 2, 2021
Financial Report Knowledge Graphs
"The reasonable man adapts himself to the world; the unreasonable one persists in trying to adapt the world to himself. Therefore all progress depends on the unreasonable man." -- George Bernard Shaw
Be unreasonable.
Financial Report Knowledge Graphs helps professional accountants understand that financial reports are knowledge graphs. In the past these financial report knowledge graphs were readable only by humans. Today with XBRL-based financial reports these financial report knowledge graphs are also readable by machines.
If you think about it you will quickly recognize that the knowledge in those knowledge graphs are the same knowledge for different parties that use that knowledge:
- The set of logical statements that is used to specify/describe how a report should be created (say by a regulator or standards setter),
- The set of logical statements used to actually create a report (say an accountant),
- The set of logical statements used to verify that the report was created consistently to the specification/description (say an accountant or software application used by an accountant),
- The set of logical statements used to independently confirm that the report was created consistently with the specification/description (say by an independent auditor),
- The set of logical statements used to extract information from the created report (say by a financial analyst or regulator).
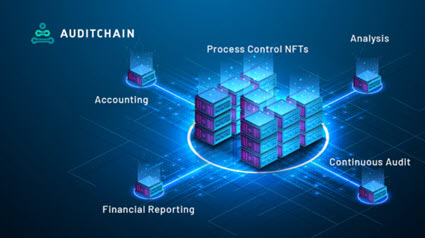
This realization is depected well in this graphic created by Auditchain. A lot of that knowledge will be instantiated in the form of NFTs. Those NFTs, which will be created by accountants (see The Economics of Digital for CPAs) and will control processes. If you are trying to understand this using the paradigm that has in place for the past 100 years, you will not understand. You need to adjust your thinking, here are the new rules.
What does a professional accountant need to understand in order to position herself or himself appropriately for the next 25 years? There are two key things that business professionals intuitively or innately understand:
- Fundamentals of knowledge graphs (see Financial Report Knowledge Graphs)
- Computational thinking (see Algorithmic Business Thinking and Computational Professional Services)
Modern accounting is on its way. Traditional audit is doomed.
###########################
 Charlie
in Digital Financial Reporting
|
Charlie
in Digital Financial Reporting
|
 Post a Comment
|
Post a Comment
|  Email
|
Email
|  Print
Print
Can Bitcoin style validation solve financial statement fraud?
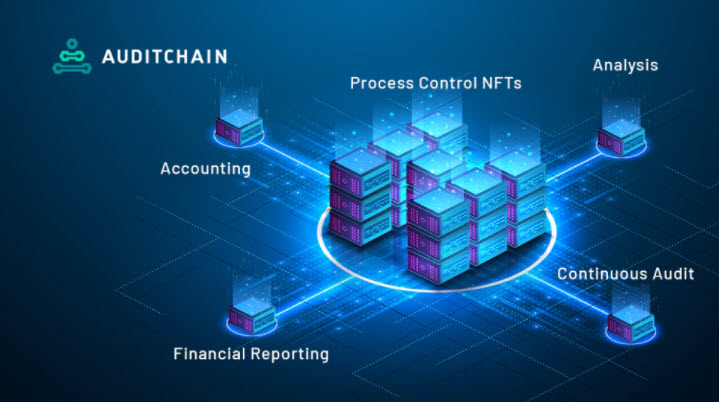
An article, Can Bitcoin style validation solve financial statement fraud?, has an excellent graphic provided by Auditchain that helps one understand the importance of NFTs. Here is that graphic:
I explained NFTs basics in another blog post. I point out the importance of process control in my method. Think modern accounting processes. Think about the notion of a financial report as a knowledge graph. Think "always on" audit as Engine B calls it or the "dynamic audit initiative" as the AICPA calls it. Think about ideas like Imagineering Audit 4.0 and the mirror worlds they discuss. Think about artificial intelligence assisted audits.
Think about how poorly current audit is performing.
Is traditional audit doomed?
Charlie
in Digital Financial Reporting
|
Post a Comment
| Email
| Print
JSON Viewer
I ran across an interesting and useful tool today, a JSON Viewer.
To try this tool out, have a look at this by clicking on it. That will open a JSON file that was provided within the JSON viewer. Click on the "Viewer" tab and have a look.
That JSON information was created by the Pacioli logic/rules/reasoning engine. The XBRL-based report that was used to generate that JSON was this PROOF report. Pacioli took the XBRL instance, XBRL taxonomy, all the rules used to verify the report and generated this file. The file itself is not like an XML file that can expand and collapse because of a stylesheet supported by most browsers. (Like this)
Now, the JSON provided is not financial report logic based, it is XBRL technical syntax based for the most part. So that file itself is not particularly useful. One day I will get the information I want if I have to create it myself.
But, this does give me an idea! Stay tuned.
Here are some other JSON Viewers:
Charlie
in General Information
|
Post a Comment
| Email
| Print
The GQL Manifesto
The GQL Manifesto is an international effort to create an industry standard graph query language (GQL).
SQL, or structured query language, is a declarative language that one of the key underpinnings of modern information technology. SQL is the way one interfaces with a relational database management system (RDBMS) which is used to store data. One of my personal favorite tools that I have made use of during my entire career as an accountant has been Microsoft Access and Microsoft SQL Server.
The international effort to create GQL is an industry attempt to create a similar industry standard for graph databases. It is highly likely that this effort will be successful and GQL will very likely become an ISO standard GQL.
What would be incredible in my view is if Microsoft were to create a product similar to Microsoft Access or if they were to enhance Microsoft Access to support GQL. Having this as part of the Microsoft Office suite of products would be a very good thing in my view.
The book Graph Databases that is published by Neo4j provides an excellent explanation of the fundamental difference between a graph database and a relational database. See Chapter 2, Options for Storing Connected Data, page 11 which is PDF page 29. Here is my attempt to explain that difference.
In a relational database, information about relationships is not part of the actual relational model. In a graph database, information about relationships is fundamentally part of the information model.
That statement might seem odd. But it is true. Relationships are not "first class citizens" in relational databases, but they are in graph databases. Now, you can absolutely express relationships and even the meaning of relationships in relational databases. But, you have to do it in the database itself, you cannot do it as part of the database schema. In a graph database the relationship information is part of the schema rather than added into the data.
Graph databases are fundamentally more powerful that relational databases.
Charlie
in General Information
|
Post a Comment
| Email
| Print
The Accountant Quits
The Accountant Quits is a blog and podcast related to accountants and change. This is worth checking out.
Charlie
in General Information
|
Post a Comment
| Email
| Print

