BLOG: Digital Financial Reporting
This is a blog for information relating to digital financial reporting. This blog is basically my "lab notebook" for experimenting and learning about XBRL-based digital financial reporting. This is my brain storming platform. This is where I think out loud (i.e. publicly) about digital financial reporting. This information is for innovators and early adopters who are ushering in a new era of accounting, reporting, auditing, and analysis in a digital environment.
Much of the information contained in this blog is synthasized, summarized, condensed, better organized and articulated in my book XBRL for Dummies and in the chapters of Intelligent XBRL-based Digital Financial Reporting. If you have any questions, feel free to contact me.
Entries in Flow (2)
Organizing Networks and Hypercubes to Get a Flow
You have all those concepts in an XBRL taxonomy schema. You can organize those into useful groups of information. This is done by putting concepts into a network (i.e. presentation, calculation, definition). You can further organize these into hypercubes if you want to use the multidimensional model.
But, how do you organize the networks and/or hypercubes? This is what I mean by flow. (Go to that blog entry for more information on flow.)
Consider this fairly simple example of a financial statement. Here is how I did it:

What I did was the following:
- Create a definition network. I created the network role of http://www.example.com/DocumentFlow. (You could do this using the presentation network, but if you use the definition network you can create custom arcroles, I will get to that in a moment.)
- Create an arcrole if you want, but I just used the "general-special" arcrole for now.
- Use abstract concepts and the hypercubes you have created in your taxonomy to organize the flow of the report.
Here is another version of that screen shot, an HTML page where you can see both the flow and the other parts of the XBRL taxonomy.
There are some important characteristics of networks and hypercubes which you need to understand in order to understand the issues and solve them.
- There is no way to order networks in XBRL. Or rather, there is no standard way. You can always create a proprietary way, but the problem is that if users are using different software applications they will very likely get different results. Two ways to overcome this are to (a) use the physical order in which the networks appear or (b) sort the networks by their definition. Sorting by the definitions of the networks is how the US GAAP Taxonomy was built to be used, that is why the numbers are in the network definitions.
- There is no way to provide a hierarchy of networks in XBRL. You can order the networks by using one of the two approaches above, but that approach limits you to a flat sorted list. It would be nice if you could put the networks into a hierarchy, like the taxonomy concepts themselves.
- You cannot "jump" between networks. A good way to understand this is to say that you can jump between networks in the definition linkbase if you use XBRL Dimensions. This is achieved using the targetRole attribute. What this allows is for pieces of a hypercube (the dimensions, the domains, the members, the primary items) to be defined within different networks (i.e. extended links of the same role) but then use them together. This is a very handy feature. But again, it does not exist in XBRL 2.1, only in XBRL Dimensions.
- Hypercubes are XBRL taxonomy schema XBRL elements all of which have the substitutionGroup value of "xbrldt:hypercubeItem".
- So, to organize the hypercubes into a flow, I simply create a network which includes only abstract elements which provide a means of adding hierarchy or structure and then put each hypercube into that structure in the order that I want to see it.
Now, there are some subtleties which are helpful to understand. To make this work, you should give each hypercube a unique name. If you do this, the network really becomes irrelevant from a flow perspective, as the hypercube becomes your way to identify which piece of the taxonomy you want to point to. Besides, personally, I believe that it is a good idea to give each unique hypercube a unique name which describes what that hypercube is trying to communicate. In contrast, the US GAAP Taxonomy used the same hypercube "Statement [Table]" for every primary financial statement. For example, here that one hypercube is used to define a balance sheet and here that very same hypercube is used to define an income statement. What that means is that you MUST use the network in addition to the hypercube to identify the hypercube. Whereas, if the names were unique, you would only need the hypercube name to identify the hypercube. The fact that the US GAAP Taxonomy uses the same hypercube to mean different things, the approach outlined above will not work for that XBRL taxonomy. So, when you build your XBRL taxonomy, I would suggest making each hypercube name unique.
Then, what this allows is an interfact which looks something like this. Notice the flow on the left. Each hypercube shows up in the list, they can be read from the "flow" network which you define. Click on the hypercube, and that hypercube is rendered in the right side pane.
That flow network allows for two things: First, you can define the order that you want. Second, if other users don't like your flow, the can change it by simply creating an extension to the XBRL taxonomy! Altertatively, they can simply create their own flow network in the form of an XBRL taxonomy.
For example, you could put line items, policies, and disclosures which relate to each other together as you see desire. Interactive information!
 Charlie
in Flow, Modeling Business Information Using XBRL, XBRL General Information, hypercubes, networks
|
Charlie
in Flow, Modeling Business Information Using XBRL, XBRL General Information, hypercubes, networks
|
 Post a Comment
|
Post a Comment
|  Email
|
Email
|  Print
Print
Notion of Flow
This blog entry builds upon this blog entry which articulates the idea of an interactive information hypercube. You should also take a look at this blog entry which discusses shape.
If you look at this interactive information hypercube viewer, look at the left hand pane. You will see the bold heading "Flow of Report". Below that you see a list of components of the report:
- Sales Analysis
- Accounting Policies
- Property, Plant and Equipment; by Component
- Property, Plant, and Equipment; Movements
- Director Compensation
The flow organizes the different hypercubes into the order the creator of the instance document containing the information wants the user to use that information.
There is no standard way to express the flow information within an XBRL taxonomy. So, I created my own way which is 100% XBRL compliant. This is not to say that it is standard. Sure, an XBRL taxonomy tool can read the information, but to do anything with it which to help you render the flow information the application would have to understand that flow information.
The way I did this was to organize each hypercube under a special network which specifically articulates the flow. For example take a look at the different hypercubes from the exampleshown on the "Notion of Shape" blog entry (see above). It looks like this (within the UBmatrix Taxonomy Designer application):
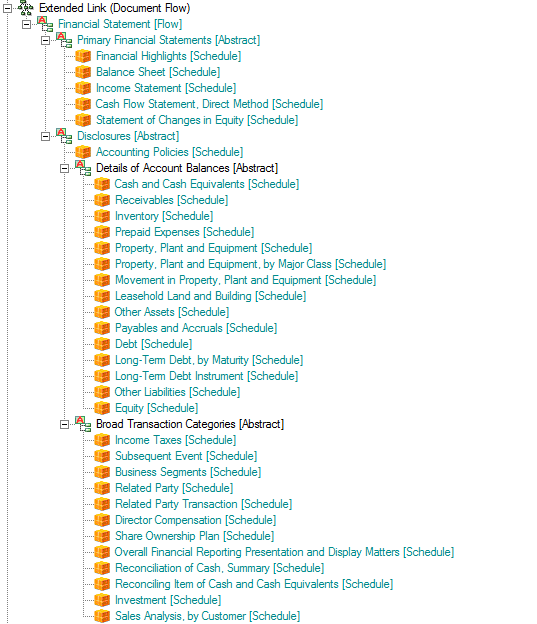
This is what amounts to a special meta pattern which articulates the flow as an organization of hypercubes with some "helper" abstract concepts to provide some hierarchy and therefore levels within the flow organization. All the line items marked "[Schedule]" are hypercubes in the XBRL taxonomy.
You want to change the flow? No worries. All you need to do is edit the XBRL taxonomy, changing the order of the hypercubes and you change the order of the way you look at the report.
So, that is what I call flow; it is simply the order that you want to see the information from an XBRL instance, articulated as a structure within an XBRL taxonomy. Change that flow by changing the taxonomy.
Charlie
in Flow, Modeling Business Information Using XBRL, XBRL General Information
|
1 Comment
| Email
| Print
