BLOG: Digital Financial Reporting
This is a blog for information relating to digital financial reporting. This blog is basically my "lab notebook" for experimenting and learning about XBRL-based digital financial reporting. This is my brain storming platform. This is where I think out loud (i.e. publicly) about digital financial reporting. This information is for innovators and early adopters who are ushering in a new era of accounting, reporting, auditing, and analysis in a digital environment.
Much of the information contained in this blog is synthasized, summarized, condensed, better organized and articulated in my book XBRL for Dummies and in the chapters of Intelligent XBRL-based Digital Financial Reporting. If you have any questions, feel free to contact me.
Entries in hypercubes (3)
Semantic Meaning of Networks and Hypercubes
Here are some nuances that most people don't really understand when it comes to modeling XBRL. This is one example of a theme. The theme relates to consistent meaning within an XBRL taxonomy.
The Detail
Consider the following SEC XBRL filing taxonomies. These are renderings which I generated. Here, we will be looking at the networks (i.e. extended links with the same role) and hypercubes. This is more about providing you with some detailed information to look through should you find the need.
- Ebay: This balance sheet is within a network, it has a [Table], that table has [Axis] and line items.
- All these are the same: You can look through all these and they are all the same as Ebay. All these filings were created by Edgar Online.
- Another way to look at the same thing: You can look at the same thing in yet another way. Each extended link has a hypercube called "Statement [Table]", each hypercube has at least one [Axis] and exactly one set of [Line Items].
- More Inconsistent: This set of SEC XBRL filings is more inconsistent. Some have [Table]s within the networks, some don't, some use [Axis] and [Line Items] on the [Table]s, some don't.
The Summary
So what is going on here and what is the point? The big picture is that XBRL and the SEC allow you to model an XBRL taxonomy with the following options:
- Within a Network (i.e. an extended link of a specific role) which contains no hypercube. (Qwest does this.)
- Within a Network which does contain a hypercube but each hypercube has the same name. In the examples above you see the hypercube "Statement [Table]" being used over and over. (Citigroup does this, 34 networks, "Statement [Table]" used 34 times.)
- Within a Network which does contain a hypercube and each hypercube has a different name. (Carnival is the closest to this, but many of the hypercubes don't have [Axis] and/or [Line Items].)
The Analysis
What is going on? What do these different options or varieties actually mean? What is the difference between one or the other? The answer is no one really can know because it is not documented. Are these wrong? No, none is wrong as they all pass SEC XBRL validation. Are these right? Sure, they pass validation, but they may not be the best of practices.
Basically, these are possible ways to construct an XBRL taxonomy:
- Network alone.
- Network with one hypercube (and therefore they can have the same name).
- Network with multiple hypercubes (this required different hypercube names).
How will each of these be rendered by the SEC XBRL rendering engine? Where does the network show up in the rendering engine and where does the hypercube show up?
Why can't these be consistent? What possible downside could result?
Important Characteristic of Hypercubes
Hypercubes do something useful that not using hypercubes can never achieve. You have to articulate the [Axis] and the allowed values for each [Axis] which are called [Member]s or [Domain]s in the taxonomy. Further, you can only use what has been specified in the taxonomy. Whereas, there are no constrains on things like the entity identifier and period portion of context; they are unconstrained by the hypercube. This has two affects. First, users have no real idea of what you want reported unless you document it somewhere else because it is not documented in the taxonomy. Second, you get stray fact values showing up in things like calculations because the hypercube cannot constrain entity identifier and period. Or, another way of looking at it is that the more you use hypercubes the more control you have over what facts are used by the hypercube...that is what the hypercube does is constrain the concepts, [Axis], and [Member]s.
Bottom Line
Properly build hypercubes are easy to render because you can use the [Axis], the concepts, the [Domain]s, and the [Member]s to help in the rendering process. Frankly, there is really little need (i.e. no need) for both networks and hypercubes to have semantics. Hypercubes are better than networks because hypercubes provide more useful features/characteristics.
Understanding the [Table] in the US GAAP Taxonomy
I have received a number of questions about the [Table] in the US GAAP Taxonomy. What I want to do with this blog post is point out some big picture things which help you get a better understanding of what exactly a [Table] is, how to use them, and answer a the questions which I have received.
As can be seen by this analysis the [Table] is not well understood by SEC XBRL filers. The inconsistency of the SEC XBRL filings are a good indication of this lack of understanding.
But understanding and using the [Table] does not need to be complicated or hard to understand. You can make this vastly easier. When business users realize this, they will start to point software developers down the right path. I have not seen one software application which has used any creativity to make creating [Table]s intuitive for business users.
Further, the ideas which can make [Table]s easier to use and understand can also be applied to [Roll Forward] and other information modeling patterns within the US GAAP Taxonomy. I published a document called US GAAP Taxonomy - Tips, Tricks, and Traps in 2008. These sections of that document are very helpful in understanding [Table]s:
- Section 2.2: Organization of the Taxonomy
- Section 2.3: Understanding the Modeling Patterns Used Within the UGT
- Section 2.4: Understanding the Tables and Dimensions
- Section 2.5: Understanding Networks and Relations
- Section 2.6: Modeling Options, Syntax and Consistency
The information is slightly dated, but the general concepts are still very much applicable. Eventually I will do a better job of organizing and explaining this information, but there are only so many hours in the day.
Further, if you really want a good understanding of the US GAAP Taxonomy, read through the information in Section 3: General Information (applicable to all networks) and Sections 4 through 60. These will be particularly helpful when you get into detailed tagging of the disclosures.
The Big Picture
Here is the big picture. The [Table] is really a hypercube. The US GAAP Taxonomy uses the term [Table] because the creators thought the term is easier for business users to relate to. However, what that term tends to do is cause confusion between the presentation of information and the modeling of information, which is unfortunate. Another term used to describe hypercube is simply cube or data cube. You may be familiar with this term from business intelligence (BI) software or corporate performance management (CPM) software.
To be precisely correct, the term you really want to understand is hypercube and here is why this is important to understand. Bear with me, you will realize that if you don't understand this you will never fully and properly understand the US GAAP Taxonomy.
- Scalar: A scalar is data which has no dimensions. For example, the value for pi (which is 3.14) has no dimensions.
- Table or matrix: A table (think a spreadsheet or a relational database table) or matrix has two dimensions. A table is basically a two dimensional hypercube. Think rows and columns, you basically have an "X" axis and a "Y" axis.
- Cube: A cube has three dimensions. Think a third dimension, you have an "X" axis, a "Y" axis and a "Z" axis. Remember math class when they talked about that Z axis, turning a two dimensional graph into a three dimensional graph?
- Hypercube: A hypercube has any number of dimensions, or "n" dimensions. Hypercubes are harder to express visually. To do this you have to lock a dimension like you do in an Excel pivot table or repeat headings like is done in printed reports. The term for this is slicer or looking at a "slice" of information.
If you are still reading, good job! This blog post is for you. A lot of people probably have already given up trying to understand this. But you want to keep going because this information is critical for you, it will exist in your future.
A hypercube is a notion of the multidimensional model. The multidimensional model is a flexible way of organizing information. The multidimensional model is gaining more and more popularity because of its utility in making information flexible. BI and CPM software use the multidimensional model because of this flexibility. You may be more familiar with the term "relational model". The relational model is used by relational databases. The relational model is great for transaction processing but it tends to be too restrictive for analysis. That is why the multidimensional model is used for analysis.
What does all this have to do with the US GAAP Taxonomy and the [Table]? A [Table] is really an XBRL Dimensions hypercube. It is expressed in the presentation relations in a certain way. That [Table] is also expressed in the definition relations in a specific way. The way hypercubes are expressed within the definition relations is dictated by the XBRL Dimensions specification and it MUST be the same for EVERY XBRL taxonomy.
The way a [Table] is expressed in the presentation relations in the US GAAP Taxonomy is dictated by the US GAAP Taxonomy architecture. It is consistent. That consistency allows for a computer application to auto-generate the definition relations based on the presentation relations. That is how the definition relations were created by the US GAAP Taxonomy, they were auto-generated.
How do you create your definition relations? Probably by hand. Why is that? Because your software vendor does not realize and leverage this fact. But they could.
Here is another thing relating to [Table]s. Per the US GAAP Taxonomy Architecture (see section 4.5, page 38 of this PDF), a [Table]:
- MUST have at least on [Axis] but can have any number of axes
- MUST have exactly one set of [Line Items]
So, why does your software allow you to put something other than an [Axis] or a [Line Items] concept as a child of a [Table] in your software application???
There are many other rules relating to [Table]s, [Axis]s, [Domain]s, [Member]s, [Line Items]s, and so forth. There are other information modeling patterns such as a [Roll Forward] which have other rules. Software can, and likely eventually will, leverage these relations. Doing so will make it easier for business users to understand and use [Table]s and other such relations.
Issues with [Table]s
The first problem with [Table]s is that if you DON'T build your [Table]s consistently (i.e. you do this) you CAN'T use this leverage.
But there are other issues which you may, or may not, be thinking about. But the issues do exist:
- [Table] express business semantics: A [Table] expresses business semantics, or is supposed to. For example, this [Table] says the following: A balance sheet has two [Axis], a "Scenario" and a "Class of Stock". Those two [Axis] apply to every concept within [Line Items] of that [Table]. Opps! The concept "Cash and Cash Equivalents" has a class of stock [Axis]. Yes, that is what the [Table] says. More on this in a moment.
- [Table]s are connected to other [Table]s: For example, summary information is connected to detailed information such as this line item from the balance sheet which also exists within the disclosures. This is a business semantics, not a technical idea. The disclosures provides details of the summary item which appears on the balance sheet. Yet, in the example shown, the concept inventory is shown in a [Table] on the balance sheet, but it is not in a [Table] in the disclosures. This brings us to another issue, which we will cover next. But, in many cases different concepts are used to express exactly the same business concept used within the summary information and as the total of the detailed information and no real connection understandable by a computer exists.
- Some things are [Table]s, other things are not: Basically a multidimensional model is mixed with a non-dimensional model, not a good idea. In the case of inventory above the same concept is used in both the summary balance sheet and in the detailed disclosures and the connection is clear. One reason this is bad is that XBRL Formula works either with a dimensional model or with a non-dimensional model. Mixing the two causes serious issues. To work around this to a degree XBRL Dimensions "default dimensions" was used to hack a connection and to try and get this to work correctly. Another way of looking at this is what if everything were a [Table]? One could be explicit about [Axis] (rather than implicit) and there would be now issues relating to mixing a dimensional model and a non-dimensional model.
- Sometimes dimensions are an [Axis] other times dimensions are items: Here on the balance sheet, Property, Plant and Equipment is an item, as is Land and the other classes of PP&E. But here in the disclosures, Land and other classes of PPE are members of an [Axis]. Why the difference?
This is only a taste of some of the issues relating to [Table]s. These will become more clear as detailed tagging of the disclosures begins to take place.
So now we circle back to the beginning of our discussion of hypercubes (i.e. [Table]s). An understanding of the multidimensional model, an understanding of how XBRL Dimensions works, an understanding if data modeling, and an understanding of the financial reporting concepts being modeled are necessary to model the US GAAP Taxonomy correctly. Likewise, an understanding is also necessary to build SEC XBRL filer extension taxonomies correctly.
In some areas the US GAAP Taxonomy is well modeled and a good example of how [Table]s should be constructed. In other areas, [Table]s are not modeled well. There are many reasons for this that I will not get into. Three big contributors to the issues of the US GAAP Taxonomy are:
- An inapproprate obsession on presentation of information rather than modeling the data correctly. What does not seem to be relized is that if the data model is correct the presentation is easy to model. But if the data model is incorrect, one may be able to present the information correctly but you cannot model the data correctly.
- Mixing a dimensional model and non-dimensional information. This leads to having to be implicit about certain information such as belonging to the consolidate entity. It also leads to misuse of default dimensions in the US GAAP Taxonomy and to issues making XBRL Formula work correctly (because XBRL Formula supports either the dimensional or non-dimensional taxonomies, not a mixture of the two)
- Insufficient understanding of how hypercubes work and of the multidimensional model by the majority of business users modeling the US GAAP Taxonomy.
All of these issues can be addressed and corrected. The first step to doing this is for more business users who understand the domain of financial reporting and what the semantics of the US GAAP Taxonomy SHOULD be saying to see what it is currently saying. This will be seen within the SEC XBRL filings. The next step is adjusting the taxonomy to say what the domain users really want it to say.
These [Table]s, hypercubes, the multidimensional model and such may be challenging to understand and it may take an investment in time. I know that this was very challenging to me and it took a while to grasp and I am not saying that I grasp everything perfectly; I still have a lot to learn. However, you have to admit that there are pretty good questions and observations.
The payback for business people understanding this is easier to use software. Once business users realize that is going on here, they will be far better equiped to tell software developers what they need from software applications.
The really good news is that the US GAAP Taxonomy is not as complicated as string theory where their are somewhere between 11 and 14 dimensions one needs to wrap their heads around.
 Charlie
in Creating Investor Friendly SEC XBRL Filings, Modeling Business Information Using XBRL, Tips, Tricks and Traps, US GAAP Taxonomy, US SEC, XBRL General Information, [Table], hypercubes
|
Charlie
in Creating Investor Friendly SEC XBRL Filings, Modeling Business Information Using XBRL, Tips, Tricks and Traps, US GAAP Taxonomy, US SEC, XBRL General Information, [Table], hypercubes
|
 Post a Comment
|
Post a Comment
|  Email
|
Email
|  Print
Print
Organizing Networks and Hypercubes to Get a Flow
You have all those concepts in an XBRL taxonomy schema. You can organize those into useful groups of information. This is done by putting concepts into a network (i.e. presentation, calculation, definition). You can further organize these into hypercubes if you want to use the multidimensional model.
But, how do you organize the networks and/or hypercubes? This is what I mean by flow. (Go to that blog entry for more information on flow.)
Consider this fairly simple example of a financial statement. Here is how I did it:
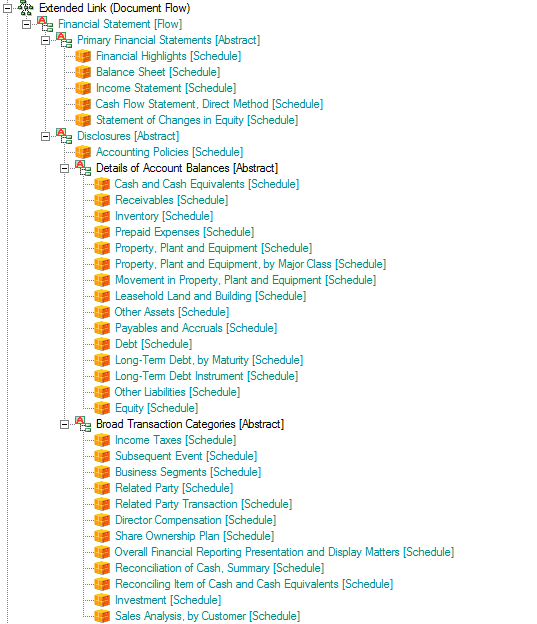
What I did was the following:
- Create a definition network. I created the network role of http://www.example.com/DocumentFlow. (You could do this using the presentation network, but if you use the definition network you can create custom arcroles, I will get to that in a moment.)
- Create an arcrole if you want, but I just used the "general-special" arcrole for now.
- Use abstract concepts and the hypercubes you have created in your taxonomy to organize the flow of the report.
Here is another version of that screen shot, an HTML page where you can see both the flow and the other parts of the XBRL taxonomy.
There are some important characteristics of networks and hypercubes which you need to understand in order to understand the issues and solve them.
- There is no way to order networks in XBRL. Or rather, there is no standard way. You can always create a proprietary way, but the problem is that if users are using different software applications they will very likely get different results. Two ways to overcome this are to (a) use the physical order in which the networks appear or (b) sort the networks by their definition. Sorting by the definitions of the networks is how the US GAAP Taxonomy was built to be used, that is why the numbers are in the network definitions.
- There is no way to provide a hierarchy of networks in XBRL. You can order the networks by using one of the two approaches above, but that approach limits you to a flat sorted list. It would be nice if you could put the networks into a hierarchy, like the taxonomy concepts themselves.
- You cannot "jump" between networks. A good way to understand this is to say that you can jump between networks in the definition linkbase if you use XBRL Dimensions. This is achieved using the targetRole attribute. What this allows is for pieces of a hypercube (the dimensions, the domains, the members, the primary items) to be defined within different networks (i.e. extended links of the same role) but then use them together. This is a very handy feature. But again, it does not exist in XBRL 2.1, only in XBRL Dimensions.
- Hypercubes are XBRL taxonomy schema XBRL elements all of which have the substitutionGroup value of "xbrldt:hypercubeItem".
- So, to organize the hypercubes into a flow, I simply create a network which includes only abstract elements which provide a means of adding hierarchy or structure and then put each hypercube into that structure in the order that I want to see it.
Now, there are some subtleties which are helpful to understand. To make this work, you should give each hypercube a unique name. If you do this, the network really becomes irrelevant from a flow perspective, as the hypercube becomes your way to identify which piece of the taxonomy you want to point to. Besides, personally, I believe that it is a good idea to give each unique hypercube a unique name which describes what that hypercube is trying to communicate. In contrast, the US GAAP Taxonomy used the same hypercube "Statement [Table]" for every primary financial statement. For example, here that one hypercube is used to define a balance sheet and here that very same hypercube is used to define an income statement. What that means is that you MUST use the network in addition to the hypercube to identify the hypercube. Whereas, if the names were unique, you would only need the hypercube name to identify the hypercube. The fact that the US GAAP Taxonomy uses the same hypercube to mean different things, the approach outlined above will not work for that XBRL taxonomy. So, when you build your XBRL taxonomy, I would suggest making each hypercube name unique.
Then, what this allows is an interfact which looks something like this. Notice the flow on the left. Each hypercube shows up in the list, they can be read from the "flow" network which you define. Click on the hypercube, and that hypercube is rendered in the right side pane.
That flow network allows for two things: First, you can define the order that you want. Second, if other users don't like your flow, the can change it by simply creating an extension to the XBRL taxonomy! Altertatively, they can simply create their own flow network in the form of an XBRL taxonomy.
For example, you could put line items, policies, and disclosures which relate to each other together as you see desire. Interactive information!
Charlie
in Flow, Modeling Business Information Using XBRL, XBRL General Information, hypercubes, networks
|
Post a Comment
| Email
| Print
