BLOG: Digital Financial Reporting
This is a blog for information relating to digital financial reporting. This blog is basically my "lab notebook" for experimenting and learning about XBRL-based digital financial reporting. This is my brain storming platform. This is where I think out loud (i.e. publicly) about digital financial reporting. This information is for innovators and early adopters who are ushering in a new era of accounting, reporting, auditing, and analysis in a digital environment.
Much of the information contained in this blog is synthasized, summarized, condensed, better organized and articulated in my book XBRL for Dummies and in the chapters of Intelligent XBRL-based Digital Financial Reporting. If you have any questions, feel free to contact me.
Entries from December 1, 2018 - December 31, 2018
Understanding the Meta-Model of a Financial Report
In his paper On the Unification Power of Models, Jean Bézivin points out the advantages of models: conceptual simplicity, clear architecture, efficient implementation, high scalability, and good flexibility. Even models can have models. A model of a model is a meta-model. You can even have meta-meta-models!
Models are basically about leveraging patterns. I have been pointing out the conceptual model of a financial report for quite some time.
So, I think that what I am actually representing is the meta-model of a financial report. I say that because each financial report created is actual itself a model. Both OMG and ISO describe the difference between and implementation, a model, and a meta-model. It seems that in a financial report facts are reported, the reporting entity describes and represents those fact relative to other facts in a model, and that financial report model is described by a meta-model.
Here is the most recent version of my model, or meta-model, of a financial report which is a type of business report:
- Report: A report is a set of identifiable facts distinguished from one another by one or many characteristics plus information that can be used to describe and verify the logical, mechanical, mathematical, structural, and other such relations between facts.
- Fragment: A fragment is a part of a report. A report is made up of one or many fragments. A fragment is a set of facts.
- Fact: A fact defines a single, observable, piece of information contained within a report, or fact value, conceptualized for unambiguous interpretation or analysis by one or more distinguishing characteristics. Facts can be a single numbers, a phrase of text, or prose (a set of numbers and/or text formatted generally for human consumption).
- Characteristic: A characteristic describes a fact (a characteristic is a property of a fact). A characteristic provides information necessary to describe a fact and distinguish one fact from another fact. A fact may have one or many distinguishing characteristics.
- Fact Table: A fact table is a set of facts which go together for some specific reason. All the facts in a fact table share the same characteristics.
- Relation: A relation is how one thing in a report is or can be related to some other thing in a report. These relations, often referred to as business rules, describe logical, mechanical, mathematical, structural, and other such constraints. There are three primary types of relations (others can exist):
- Whole-part: something composed exactly of their parts and nothing else; the sum of the parts is equal to the whole (roll up).
- Is-a: descriptive and differentiates one type or class of thing from some different type or class of thing; but the things do not add up to a whole.
- Computational business rule: Other types of computational business rules can exist such as "Beginning balance + changes = Ending Balance" (roll forward) or "Net income (loss) / Weighted average shares = Earnings per share".
- Grain: Grain is the level of depth of information or granularity. The lowest level of granularity is the actual transaction, event, circumstance, or other phenomenon represented in a financial report.
Essentially, the model of a business report and therefore a financial report is the multidimensional model.
Now, when the XBRL technical syntax was created, certain terms were used. Unfortunately, the XBRL technical syntax was created without the logic of a business report being expressed within a model. And so, there are some differences and inconsistencies in the terms used by the XBRL technical syntax. Further, when the US GAAP XBRL Taxonomy and IFRS XBRL Taxonomy were created, they used even different terms. For example, people thought that the term "hypercube" and "dimension" were too technical and so they used the terms "Table" and "Axis" instead. All these terms cause confusion.
Here are the terms used by those implementing software, in the creation of XBRL taxonomies or the model structure of the report, and used within the XBRL technical specification to describe a business report:
- Network/Group: A Network is a technical artifact that really has no meaning by itself because those creating XBRL-based digital financial reports use Networks in different ways. Other terms used to describe a network are "group" and "base set". A Network/Group essentially breaks a report into fragments.
- Hypercube/Table: A Table is the same thing that XBRL calls a hypercube. A Table/Hypercube simply groups some set of Axes, Members, Line Items, Abstracts, and Concepts together into a logical structure. Again, because Table's are used inconsistently by creating XBRL taxonomies, they really have no meaning by themselves. Tables/Hypercubes are essentially another way to break a report into smaller fragments.
- Dimension/Axis: An Axis, or what XBRL calls a dimension and XBRL Formula calls an aspect, is one approach to representing a Characteristic. Entity and period core dimensions that are always required. Those creating XBRL taxonomies can create additional non-core dimensions.
- Member: A Member is a possible value of a Characteristic.
- Primary Items/Line Items: A Line Items, or Primary Items as called by the XBRL Dimensions specification, is in essence a special type of Dimension/Axis which specifies a data type, period type, and optionally a balance type. Line Items/Primary Items are Characteristics.
- Abstract: An Abstract is simply used to organize Line Items/Primary Items; they provide no real meaning. When used, Abstracts can make a model easier to understand.
- Concept: A Concept is in essence a type of Member. You can think of a Concept as a value for the Line Items Characteristic. A Concept is special in that it can be used to represent a Fact Value.
- Fact: A Fact is a fact value plus all supporting Characteristics which describes the fact. Numeric facts have the additional properties of rounding and units. Optionally, a fact can be associated with one to many parenthetical explanations.
- Parenthetical explanation: A parenthetical explanation (implementation of an XBRL Footnote) is a property of a fact which provides additional descriptive information about the fact. Basically, a parenthetical explanation is a comment that you add to a Fact.
- Report: A report is the combination of an XBRL instance plus the XBRL taxonomy schema and all linkbases which describe and can be used to verify the logic, mathematics, structure, mechanics, and other such information within the report.
To test this model, I looked at the pieces and the relations which made up the model structure between the pieces in 5,734 XBRL-based reports, all of which were 10-Ks, to examine the relations between the pieces that made up the report. This matrix summarizes the results:
 (Click image for larger view)
There is one additional structural piece that I created for the purpose of untangling the XBRL-based reports that are submitted to the SEC which are maybe 10% t0 20% of the time structured "illogically" or more complicated than the representation really needs to be mainly because many of the creators of reports tend to be more focused on the presentation of the reports rather than the representation of the information contained in the reports.
I call this additional "utility" structure that I created the Block. A Block is simply a fragment of a report that shares the same Concept Arrangement Pattern and Member Arrangement Pattern. A concept arrangement pattern is simply how Line Items/Primary Items can be logically organized and a member arrangement pattern is simply how Members of a Dimension/Axis are organized.
The notion of a Block would not be necessary if XBRL taxonomies where architected "crisply". You only need Blocks to untangle poor taxonomy designs which lead to poor report representations.
Financial reports submitted to the SEC using US GAAP or IFRS follow the model described above. ESMA appears to be using that same model. AISC which uses IFRS AU also follows that model. See this side-by-side comparison. As such, this model appears to be somewhat of a de facto standard meta-model of a financial report.
There is one more part of the meta-model of a financial report. That other thing is the "stuff" that goes into the model such as "assets", "liabilities", "equty", "net income", "net cash flow", and such.
From early meetings of XBRL International such as the one in London, people have been calling for US GAAP and IFRS to share certain concepts. So, I still don't know if this is a good idea or not. But, an alternative is to map high-level US GAAP terms to their closest counter part in IFRS. I am not saying that these financial report items are measured the same or even mean the same thing. I am simply pointing out similarities which result from a financial reporting scheme following the accounting equation which is the basis for double-entry accounting.
Now, if you talked to the typical accountant about this comparison across reporting schemes; they would likely be pedantic and miss the point. They would say, "You cannot compare US GAAP and IFRS." First, I am not 'comparing'. What I have done is created a four column list and in each column I have provided the concepts in the different reporting schemes that have the closest match. Yes, it is true that "Assets" is measured differently and defined differently under IFRS than US GAAP. HOWEVEVER, that does not mean that this information below is not useful. Notice the extremely high correlation of high-level accounting concepts reported under US GAAP, IFRS, and IFRS AU. That is not a coincidence. You might not be aware of the accounting equation: Assets = Liabilities and Equity. All this other "stuff" is just a breakdown of the details of assets, liabilities, and equity.
If you look at this pragmatically, this is incredibly useful information for a host of reasons.
As far as I can tell, FIBO (Financial Industry Business Ontology) defines a number of terms including: assets, liabilities, and equity (see this RDF file). EVERY financial-related reporting scheme might define assets, liabilities, and equity differently. However, all the pieces WITHIN "assets" and "liabilities" and "equity" MUST act correctly per the rules of double-entry accounting which is defined very clearly in mathematical terms how double-entry accounting work.
Financial reporting taxonomies simply cannot make stuff up; they are beholden to the higher-level logic of the accounting equation and other logical, mathematical, mechanical, and structural well understood "rules of the road" so to speak.
And so, it makes sense that certain high-level concepts will be the very similar or the same, and they are, even though these can be measured differently when creating a financial report.
Here is a comparison of US GAAP, IFRS, and IFRS AU high-level terms: (see pages 7 to 11)
 (Click image, see pages 7 to 11)
So basically, the FASB and IASB follow a meta-meta model when they create their US GAAP and IFRS meta data and represent that in the form of the US GAAP and IFRS reporting schemes. The FASB and IASB don't get to define the logic of double-entry accounting.
There are other meta-meta models that financial reporting must follow. Mathematics is one of them. Roll ups and roll forwards are defined by the rules of mathematics, not by the FASB or IASB.
And so, the logical, mathematical, structural, mechanical, and other such rules are not defined by economic entities that create fianancial reports; rather those rules are defined by a higher meta-model (or meta-meta model) to which all financial reports mush comply.
 Charlie
in Becoming an XBRL Master Craftsman
|
Charlie
in Becoming an XBRL Master Craftsman
|
 Post a Comment
|
Post a Comment
|  Email
|
Email
|  Print
Print
XBRL Taxonomy Creator Prototoype Shows Real Time Validation
I created a working prototype XBRL Taxonomy Creator software application using Microsoft Access. You can DOWNLOAD a ZIP archive containing the Access application and run it for yourself (requires a Microsoft Access license or for you to download and install the Microsoft Access runtime.)
You can see how this XBRL taxonomy creator prototype works by watching this video. If you watch the video you can see how to use the application, but it really is pretty simple.
Here is my point. The US GAAP XBRL Taxonomy Architecture, section 4.5 Implementation of Tables dances aroundthe idea but does not specifically state that (a) the report elements of an XBRL taxonomy fit into categories and (b) those categories of report elements have specific, allowed relations. By "dances around" I mean that they are not explicit.
But I am being explicit. EVERY report element that is used to define the structure of an XBRL-based report fits into exactly one of the following categories:
- Network (or called BASE SET by Edgar Filer Manual and GROUP by US GAAP and IFRS XBRL Taxonomies)
- Hypercube (or called Table by US GAAP and IFRS XBRL taxonomies)
- Dimension (or called Axis by US GAAP and IFRS XBRL taxonomies)
- Member
- LineItems (or called Primary Items by XBRL Dimensions)
- Concept
- Abstract
Those categories of report elements can be related to one another per this matrix that I created (NOTE that my matrix is far more strict than what is allowed by the SEC, I also have a matrix that matches the SEC allowed relations.
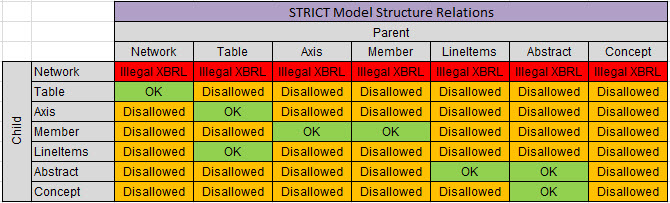 (Click image for larger view)
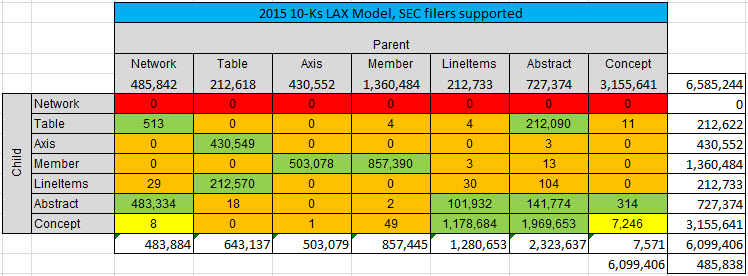
So, what does the SEC allow? Well, here is my measurement of the relations from the 2015 10-Ks which is pretty darn good empirical evidence as to what is allowed: (the numbers show the actual numbers of the report elements and the relations between the report elements.
(Click image for larger view)
GREEN is what is allowed, RED and ORANGE are clearly disallowed, and YELLOW is somewhat questionable but looking like they should be DISALLOWED. For example, the number of CONCEPTS that had other CONCEPTS as children went form 13,346 in 2013 down to 11,391, and is now at 7,246. So the evidence seems to point to the idea that this is not really a good idea. What exactly does it mean for a CONCEPT to have another CONCEPT as a child in a model?
You can distill that matrix into machine-readable information such as this set of XBRL definition relations which represents the SEC version of the allowed relations. And that, my friends, is how you can get software to verify these relations to make sure you are always following the rules.
Now, because I am not a programmer and because these rules rarely need to be modified; I hard-coded the rules in my Microsoft Access Database Application. XBRL Cloud has been using these model structure relations rules for several years on their EDGAR Dashboard. Notice the column "Model Structure Rules" and how that column is mostly GREEN. This is because people are following the rules because I have been sending them information about violations so they can fix their software.
But this is all done (a) in batch mode and (b) after the report is created.
Now notice my application. Notice that the validation is done IN REAL TIME as the XBRL taxonomy is being created! The software does not let you make mistakes!!! How useful is that?
Why is this important? Well, it is important for the following reasons:
- Leverage: Simply by either assigning or identifying the patterns you are working with such as the categories of report elements; software engineers can be provided with leverage. If they don't understand that these categories exist or cannot figure it out; you get harder to use software with less functionallity because they have to work with the XBRL technical syntax level.
- Ease of use: Because the software application watches over the user of the software, the user of the software does not have to deal with the technical details of creating XBRL. Notice that you never get asked about subsitutionGroup attributes or extended link values. All the technical stuff is hidden.
- Quality control: Real time validation is not limited to the model stucture relations that I am using to demonstrate real time validation. Think about the fundamental accounting concept relations, the type/class relations, the reporting checklist, the disclousre mechanics rules that I discuss in this document.
- Automation: Because tools can be easy to use and because software can reliably keep quality high; many processes and tasks related to creating a financial report can be effectively automated.
About one third of of filing agents can already get pretty good quality per my measurements of the fundamental accounting concept relations testing that I do. That is only going to increase and the scope of testing is going to also increase.
There is a feedback loop that you can see in all of this. The more software vendors and filing agents correct errors, the more XBRL-based financial reports are correct. The more XBRL-based financial reports are correct; the more the model of the reports becomes apparent. The more the model of the reports is apparent; the better the report quality.
The model structure relations are pretty basic. When you start getting into understanding the block semantics witihn a report this gets a little more complicated. However, the basic model structure ideas can help you understand the more complex ideas.
All this is about recognizing and leveraging patterns. That is how software works, by leveraging patterns. The more patterns that are intensionally created, the easier all this stuff is. Alternatively, clever and creative programmers can identify patterns and provide useful and valuable functionality to users of software.
Many tasks related to creating a financial report are dull, tedious, monotonous, and repetitious. Repetitious = patterns. Platterns = automation. Automation = higher quality, more timely information, for less cost.
Charlie
in Becoming an XBRL Master Craftsman
|
Post a Comment
| Email
| Print
Difference between Taxonomy, Conceptual Model, Logical Theory
There is a difference between a taxonomy, a conceptual model, and a logical theory. This is explained well in The Ontology Spectium by Dr. Leo Obrst. These differences are shown in this presentation by Deborah L. McGuinness, Ontologies for the Modern Age, Slide 4. I took that information and created my own graphic:
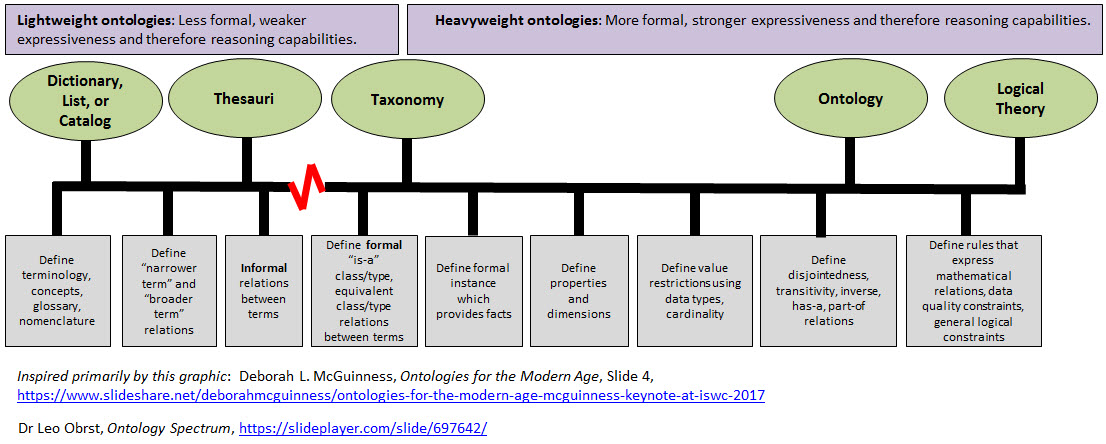
(Click image for larger view)
The graphic shows all the pieces that are necessary to control the description of, verification of, and consumption of information.
###################################
Charlie
in Becoming an XBRL Master Craftsman
|
Post a Comment
| Email
| Print
Ten Common Mistakes Made When Creating XBRL Taxonomies
I see the following 10 common mistakes made when people get together to create XBRL taxonomies:
- Don't have clear, useful requirements: The first mistake that is usually made is that clear, useful requirements or principles are not created that drive decisions.
- Confusing business domain tasks and technical tasks: Business professionals should make domain decisions; technical professionals should make technical decisions. Mixing these two tasks wastes time and leads to bad choices.
- Don't treat project as an engineering task: Taxonomies need to thought about using engineering processes and techniques. The engineering design process works to create things that work.
- Little or no consideration given to existing taxonomies: Existing taxonomies have strengths and weaknesses. If you understand those strengths and weaknesses, that information can be used to make the taxonomy you are creating better. If you don't understand those strengths or weaknesses, then you probably should not be building taxonomies.
- Don't use XBRL instances to judge if taxonomy works correctly: Ultimately, an XBRL taxonomy is used to build XBRL instances. If XBRL instances don't work correctly, then the taxonomy is not constructed correctly.
- Don't test nearly enough: Related to #3, testing is important. Most taxonomy projects test about 1% or less of what they should be testing. Testing results should drive decisions, not personal opinions. (See #3, engineering design process; prototype, test, iternate, communicate)
- Don't involve software vendors appropriately: Not involving software vendors, which create the software people using the taxonomy will interact with the taxonomy, appropriately is a big missed opportunity. That said, most software vendors don't really understand how to engage properly in a taxonomy creation project.
- Taxonomy pieces too big: Taxonomy pieces tend to be too large in taxonomies. More smaller pieces that are well organized is better. Remember, computers will be interacting with the taxonomy.
- Don't understand the "model as dimension or primary item" quesion: Endless debates occur around the topic of whether something should be modeled as a dimension or modeled as a primary item in a taxonomy. Taxonomy requirements and testing drives this decision, not personal choice.
- Not understanding and mixing dimensional and nondimensional models: The multidimensional model is well understood. The multidimensional model works well in XBRL that functionality is not open for debate. Taxonomy creators need to first understand and then work within that model not fight with it.
If the engineering design process was followed, resulting taxonomies would be superior in terms of functionality. Managing a project where a lot of different people from different domains are involved is challenging. If done right, good thing result. If not, then this is what happens:
 (Click image for larger view)
Charlie
in Becoming an XBRL Master Craftsman
|
Post a Comment
| Email
| Print
Open Source Framework for Implementing XBRL-based Digital Financial Reporting
I have taken all the puzzle pieces that I have created over the past 10 years, organized them, documented the information, and the result is the Open Source Framework for Implementing XBRL-based Digital Financial Reporting.
The framework leverages the XBRL technical syntax to represent metadata which then enables the creation of a software ecosystem which supports high function and automated quality control. While the framework is focused on the creation of financial reports, it also provides leverage for the extraction of information from those reports and then using that information for analysis.
Currently there are three software vendors that support this framework. If you want to see some basic things you can do wiith this framework, see this working prototype which provides source code or check out Pesseract.
I would not consider the documentation that explains what can be achieved by leveraging this framework to be particularly good at this point. I will improve that over time. But, for those that want to wade through the information, here you go.
If you are interested in being a consultant, helping others to implement this framework please contact me.
Ask yourself a question. What if I am seeing all of this correctly and foundational changes are coming to financial report creation?
Think about what it means if I am right about things like the utility of templates and exemplars in the process of creating financial reports. Think about what it means if Blackline is right about the financial transformation and the modern finance platform. Think about what it might mean if old-school processes of creating a financial report was replaced with new better, cheaper, and faster processes.
The painful, gruesome, grueling, barbaric process of re-keying of data may not come to an end, but the pain will be noticeably reduced over the coming years.
Do you think these changes are even possible?
Charlie
in Becoming an XBRL Master Craftsman
|
Post a Comment
| Email
| Print

