BLOG: Digital Financial Reporting
This is a blog for information relating to digital financial reporting. This blog is basically my "lab notebook" for experimenting and learning about XBRL-based digital financial reporting. This is my brain storming platform. This is where I think out loud (i.e. publicly) about digital financial reporting. This information is for innovators and early adopters who are ushering in a new era of accounting, reporting, auditing, and analysis in a digital environment.
Much of the information contained in this blog is synthasized, summarized, condensed, better organized and articulated in my book XBRL for Dummies and in the chapters of Intelligent XBRL-based Digital Financial Reporting. If you have any questions, feel free to contact me.
Entries from March 1, 2015 - March 31, 2015
XBRL International Guidance Clarifies XBRL Dimensions Semantics
XBRL International provided a document, Technical Considerations for Use of XBRL Dimensions 1.0, which clarifies semantics carried by information expressed using XBRL Dimensions. The document is worth reading but here are the highlights:
- <segment> and <scenario> elements carry no meaning: Where you put XBRL Dimensions information has no semantics. Whether you use the <segment> element of the context or the <scenario> element; the meaning is the same. XBRL International recommends using either <segment> or <scenario>; for new taxonomies they recommend using <scenario>.
- Always close hypercubes: All hypercubes (positive) should be closed. Don't use negative hypercubes without an associated positive hypercube.
- Don't mix dimensional and nondimensional models: The statement (Recommendation 3.5), "Where a taxonomy makes use of dimensions, all concepts should be associated with at least one hypercube, even if that hypercube has no associated dimensions." basically means don't mix a dimensional model and a nondimensional model.
- Dimension defaults are used to represent a total: The statement (Recommendation 5.1) "Dimension defaults should only be used to specify a member which is the natural total for a domain." basically means that dimension defaults convey information about a total.
- Don't use complex typed dimensions: The statement (Recommendation 6.1) "Typed dimensions should only use XML Schema simple types as their data type." basically means don't use complex typed dimensions, use only simple typed dimensions only.
The US GAAP XBRL Taxonomy currently violates two of these recommendations.
The US GAAP XBRL Taxonomy mixes dimensional and nondimensional models. Not every concept belongs to a [Table] (which is the US GAAP XBRL Taxonomy name for hypercube). But that does not mean that public companies creating XBRL-based financial filings cannot conform to this XBRL International recommendation. In fact, some public companies already do this. Come public companies always represent their information associating all reported facts to a [Table].
The US GAAP XBRL Taxonomy also does not use dimension defaults per the XBRL International recommendations. Many times dimension defaults are used to convey information which is not a total. Also, many people think that dimensions defaults are about "defaults". They are not. They are about intersections between two or more different [Table]s or hypercubes. Generally one hypercube is summary and the other hypercube is a breakdown of that total.
 Charlie
in Becoming an XBRL Master Craftsman
|
Charlie
in Becoming an XBRL Master Craftsman
|
 Post a Comment
|
Post a Comment
|  Email
|
Email
|  Print
Print
Improved Version and Summary of Awesome Rendering Examples
28msec was kind enough to simplify the process of working with the rendering examples I provided in a series of blog posts (here, here, and here).
Before, I had to use escape characters in the URLs. That has changed, you no longer need to do that so the URLs are more straight forward.
Because they are going to abandon the prior format in a week or so, I will provide a new summary of URLs here. Also, although the examples I provided were for the primary financial statement information, realize that this process works for disclousres also. And so, I will start there; with disclosures:
- Disclosures
- Compare information across entities (net income breakdown)
- For DOW 30
- For Fortune 100
- For S&P 500 (takes 20 seconds)
- For Russell 1000 (takes 40 seconds)
- Compare various different sets of information across entities (done for DOW 30, but works for all groups of entities, try chaning DOW30 to FORTUNE100, SP500 or RUSSELL1000)
- General information
- Balance sheet summary (classified)
- Income statement summary (multi-step)
- Net income (loss) breakdown
- Comprehensive income (loss) summary
- Comprehensive income (loss) breakdown
- Cash flow statement summary
- Cash flow breakdown (continuing and discontinued operations)
- Key financial ratios
- Compare various different sets of information across PERIODS for the same entity (all these are for 3M, try changing the CIK number parameter to get other entities)
- General information of 3M across time
- Balance sheet summary information across time
- Income statement summary information across time
- Comprehensive income summary information across time (notice how they had an error in 2011, fixed the error, and the information has been consistent since then)
- Cash flow statement summary information across time
- Key financial ratios summary information across time
- Compare as reported information for an entity (compares entire financial statement as the entity reported the statement, American Express is shown)
- Balance sheet
- Income statement (this has some issues, showing too many periods)
- Cash flow statement (this has some issues, not showing ending balance of cash)
Recognize while you can get all this information in a HTML form readable by humans (as is shown above because it is easier to read), all this information is also available in machine-readable XML, CSV, Excel, HTML, and JSON.
Here are examples of the fact tables for the general information for the DOW 30 in various formats which removes all the rendering related artifacts which makes using the information more flexible:
As more and more business professionals make use of this information, pressure to improve the quality of this information will likely increase. Information like that shown above will make it easier for business professionals to understand the reported information.
Charlie
in Demonstrations of Using XBRL
|
Post a Comment
| Email
| Print
Even More Awesome Rendering Examples, Compare Across Periods
(These URLs will be deprecated soon, please see this summary here for improved examples.)
The first set of examples provided a comparison across entities, but was for one small part of a financial report, the breakdown of net income (loss) by total, parent portion and noncontrolling interest portion. The second set of examples showed more parts of the financial report, but was still across entities.
This third set of examples provides information about one entity across multiple periods:
- General information
- Balance sheet summary information
- Income statement summary information
- Net income (loss) breakdown
- Comprehensive income (loss)
- Comprehensive income (loss) breakdown
- Net cash flow summary information
- Net cash flow breakdown
- Key financial ratios
Now, imagine being able to drill down into any of those numbers.
Charlie
in Demonstrations of Using XBRL
|
Post a Comment
| Email
| Print
More Awesome Rendering Examples
(These URLs will be deprecated soon, please see these improved examples here.)
Here are some more awesome rendering examples:
- General information summary for the DOW 30, this is interesting
- Cash flow statement summaries of the DOW 30, note that every one of these foots correctly
- Net cash flow breakdown between continuing and discontinued for the DOW 30
- Balance sheet summaries of the DOW 30, this shows an error where the filer reports an unclassified balance sheet which really is not an error
- Multi-step income statement comparison for DOW 30, however not everyone in the DOW 30 reports using a multi-step income statement so this does not work very well
- Comprehensive income for DOW 30
- Comprehensive income breakdown for DOW 30, has a few errors
- Net income (loss) breakdown between parent and noncontrolling interest for DOW 30
- Net income (loss) breakdown available to preferred/common for DOW 30
- Key ratios for the DOW 30, not sure if this is correct, need to look at the detail to see if each of the values is correct
We are making progress folks! These same comparisons can be done for the Fortune 100, S&P 500, Russell 1000, or any other set of entities. Thank you to 28msec for making these available to me!
Charlie
in Demonstrations of Using XBRL
|
Post a Comment
| Email
| Print
Awesome Renderings of Public Company Financial Information
(These URLs will be deprecated soon, please see these updated examples here.)
The following are two awesome renderings of public company financial information provided by 28msec. Each shows the breakdown of net income (loss) into the portions attributable to parent and attributable to noncontrolling interest:
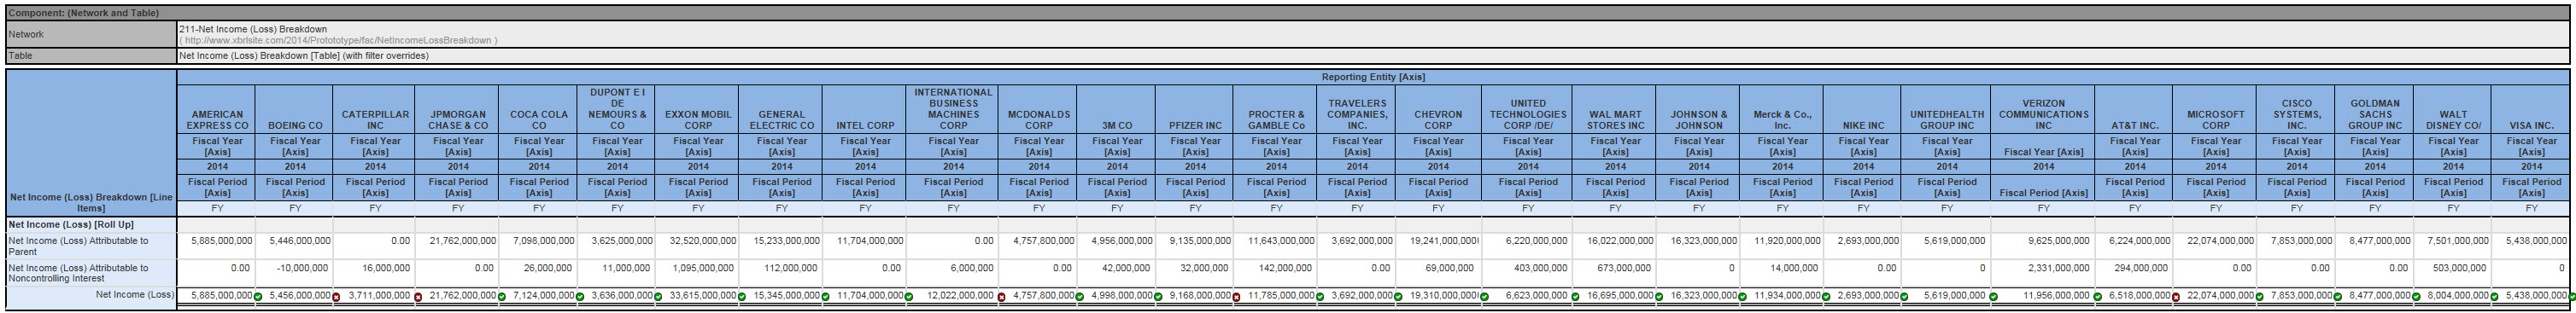 (Click image for larger view)
Here are the queries which provide the renderings for:
- Dow 30 (takes about 5 seconds to load)
- Fortune 100 (takes about 10 seconds to load)
- S&P 500 (takes about 40 seconds to load)
- Russell 1000 (takes about 1 minute to load)
Note that these are not pre-configured queries. The queries run each time the report is created, pulling in the reported facts from the 28msec database.
Note the little green checks and the red "X" by the numbers. That shows if the roll up computation is consistent with the description of how US GAAP says this information rolls up.
One improvement I see is that it would be good to put the entities into alphabetical order. I don't know what the ordering is right now.
Pretty awesome if you ask me.
Charlie
in Demonstrations of Using XBRL
|
Post a Comment
| Email
| Print

