BLOG: Digital Financial Reporting
This is a blog for information relating to digital financial reporting. This blog is basically my "lab notebook" for experimenting and learning about XBRL-based digital financial reporting. This is my brain storming platform. This is where I think out loud (i.e. publicly) about digital financial reporting. This information is for innovators and early adopters who are ushering in a new era of accounting, reporting, auditing, and analysis in a digital environment.
Much of the information contained in this blog is synthasized, summarized, condensed, better organized and articulated in my book XBRL for Dummies and in the chapters of Intelligent XBRL-based Digital Financial Reporting. If you have any questions, feel free to contact me.
Entries from May 1, 2014 - May 31, 2014
Structured Data, Legal and Illegal Structures
I have noticed that more and more people are using the term "structured data" to refer to XBRL-based financial reports. I certainly buy into that term. However, I tend to prefer the term XBRL-based digital financial reporting. Same idea though.
The "structure of the data" is a representation of the information. Far too many people make what I consider to be a mistake of using the term "tag" to describe the stuff within an SEC XBRL financial filing. I consider this to be a mistake for two reasons.
First, "tag" is too general a term. What many people refer to as a "tag" could be a Table, an Axis, a Member, a LineItems, a Concept or an Abstract. For example, if you go to the US GAAP XBRL Taxonomy (2014 version) schema and you query that schema using your favorite XML parser and the following XPath expression: //xs:element[@substitutionGroup='xbrldt:hypercubeItem']. You get exactly 301 hits, each which represents an XBRL hypercube or what the US GAAP XBRL Taxonomy calls a [Table]. Do the same thing with this XPath //xs:element[@substitutionGroup='xbrldt:dimensionItem'], and you get 327 hits, each representing an XBRL dimension or what the US GAAP XBRL Taxonomy refers to as an [Axis]. Do the same thing with the XPath //xs:element[@type='nonnum:domainItemType'] and you get 1802 [Member]s.
It starts to get a little trickier because of how the pieces are structured to get the [Line Items], the [Abstract]s and the Concepts. The point is, the 17,433 individual elements (this XPath //xs:element) can be grouped into specific categories.
Those categories of things play different roles in representing the structure of an XBRL-based digital financial report. In another blog post I pointed out that SEC XBRL financial filings use these structures very consistently. That is to be expected, because XBRL enforces many of these constraints as to how the pieces which make up the structure can be used. The XBRL definition relations have to be created very precisely and if you make a mistake, XBRL validation will point out that mistake.
Representing these structures using XBRL presentation relations is a little different. There are no real rules enforced by XBRL as how to represent information using XBRL presentation relations other than you have to follow a very general "parent-child" type hierarchy. Some SEC EFM rules apply additional constraints to the presentation relations saying that the presentation, calculation, and definition relations need to be consistent.
But the rules are still not strong enough to keep things consistent and therefore can cause potentially confusing representations of the information.
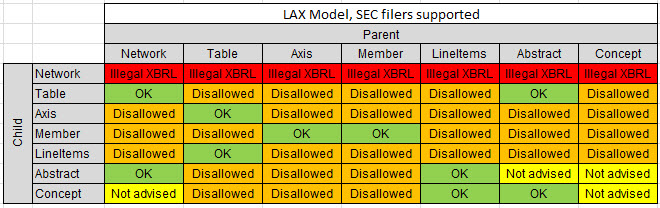
The matrix below summarizes relations which make sense and are "OK", relations which don't make sense and are therefore "Disallowed", and for relations which don't really hurt anything but really don't make sense are "Not advised". Also, note that 99.99% of all relations in SEC XBRL financial filings follow this pattern.
 (Click image for larger view)
The way to read the matrix is that the columns contain the parent structure category, the rows contain the child structure category, and the intersection cell specifies whether the relation is allowed or OK. For example, a Table can have exactly two types of children: Axis or LineItems.
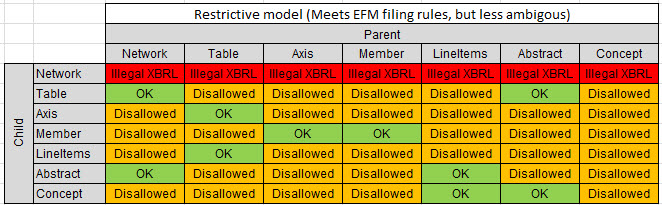
This screen shot shows a more restrictive matrix. This causes even less potential for ambiguity and would still meet all the SEC EFM rules:
 (Click image for larger view)
Here is an example of a more restrictive rule: What would you ever represent which would call for an [Abstract] to be the child of a Concept? Personally I cannot think of any reason. In fact, of 3,165,249 parent concepts in the a set of 6,674 SEC XBRL financial filings, only in 546, which is .000172% of the time, did someone feel the need to express this sort of relation. That fact alone is ample evidence that my reasoning is correct.
Why is all this important? Why are you telling me the obvious, the following categories of report elements exist in SEC XBRL financial filings: Network, Table, Axis, Member, LineItems, Abstract, Concept? If 99.99% of people already follow these rules, why is this important?
The answer, which I will build on in subsequent posts, is that this is just the beginning and there are way, way more structures. Member arrangement patterns and concept arrangement patterns are two other examples.
SECXBRL.info Opens Up New Dimensions for Testing SEC Financial Filings
I have been severely limited in terms of the testing (poking and prodding) of SEC XBRL financial filings that I have been able to do in the past because of three things.
- I had to write my own tools
- My limited programming skills
- To make things easier, I focused on one period at a time
- Information was stored correctly, but in individual files so querying was slow
Those limits no longer apply. SECXBRL.info changes all of that. Why?
#1: Easy queries
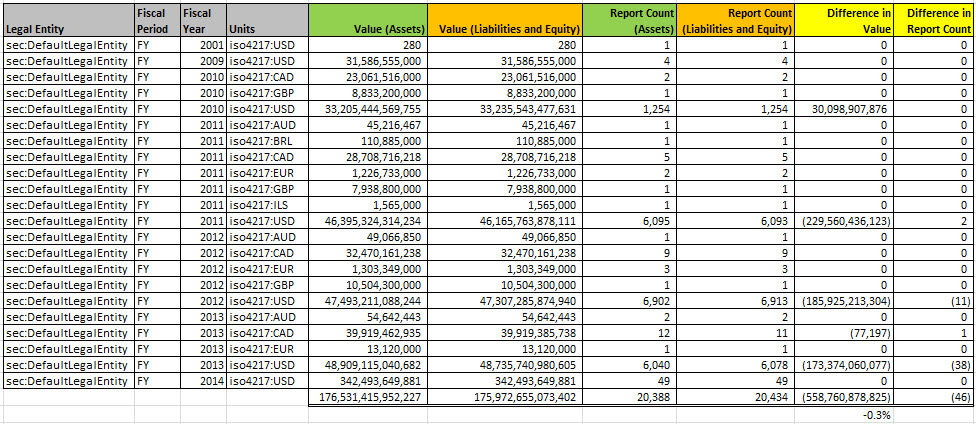
First off, the information is stored in a properly organized database which makes two things happen: (a) query execution is fast, (b) queries are easy to write. Consider this summary of all SEC XBRL financial filings:
 (Click image for larger view)
That is the result of two queries (links are provided for the queries), one for the value of assets and another for the value of liabilities and equity. Those queries take into consideration amended filings. They take into consideration that filers use different concepts to report liabilities and equity. They take into consideration something that I had totally missed, that not all filers report in US dollars.
So the SECXBRL.info API does a lot of stuff for you behind the scenes, so you don't have to deal with it. I know how to use a REST API, it is not that hard. I can program in Microsoft Excel and/or Microsoft Access using VBA. I used to have to deal with a lot of stuff in my code that I no longer need to deal with.
Take a look at that image above again. Click on it for a larger view. Accountants understand the accounting equation: Assets = Liabilities and equity. So it seems to me that it is logical to expect a query of "Asset" and a query of "Liabilities and equity" across all the filings to return the same values. Right? You might also expect that the number of filings count would be the same. But they are not. Why? Well, either the filings are wrong or the software doing the query is wrong.
Saying this another way, doesn't it seem reasonable that the SEC EDGAR system have a "dashboard" of some sort to make sure all the information in the system is correct? Seems to me that would help one manage the system, help keep the quality high, errors out of the system.
#2: Information for all periods
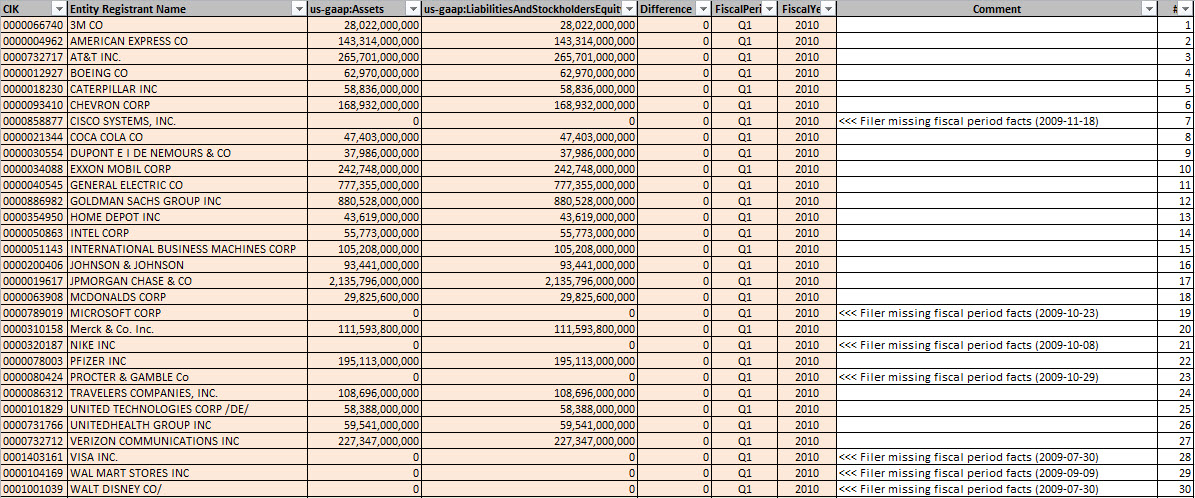
So the second thing I can do is query across many periods because of #1 (easy queries) and all the information exists in the database, not just one period. Here is something new that I can do. Consider this graph of the first quarter of SEC XBRL financial filings, this is information for the DOW 30, Q1, 2010:
 (Click image for larger view)
What you see is that for seven of the 30 DOW companies, they did not provide the fiscal period focus or fiscal year focus information in their filing. Therefore, you cannot tell with fiscal period the information relates to. Contrast the image above to the same information for the DOW 30 for fiscal year 2013:
 (Click image for larger view)
Quite a contrast, EVERY reporting entity in the DOW 30 now provides that fiscal period focus and fiscal year focus information. What does that mean? Reported information is improving and better queries are therefore possible.
Now, I am showing the DOW 30 because of the strong contrast between the 2010 filings and the 2013 filings in terms of providing the fiscal period and fiscal year focus information. This does not explain why the balance sheets do not balance for all financial reports within the SEC EDGAR database of SEC XBRL financial filings. In fact, it shows the opposite; it shows that they SHOULD balance because all of these balance for the DOW 30.
Here is why the overall dashboard does not balance:
 (Click image for larger view)
If you click on that image you see that Chrysler used the extension concept which they created, "chlr:LiabilitiesAndMembersDeficitInterest", to report liabilities and equity. Therefore, the software could not find the reported value. And so there is a value for assets and no value for liabilities and equity and therefore (a) this balance sheet does not balance and (b) it is impossible for all the balance sheets to balance and total assets of all SEC filings to equal total liabilities and equity of all SEC filings.
This analysis shows (this graphic specifically, test BS2) that assets and liabilities and equity was detectable for 99.6% or all but 29 SEC XBRL financial filings. It also shows that balance sheets balance for 6593 of 6622 SEC XBRL financial filings. As such, it would be quite hard for a filer to justify not having a detectable concept for assets or liabilities and equity and that those to values be the same within the same context. Very hard to justify.
If you download this ZIP file which contains an Excel spreadsheet you will find information related to the DOW 30, the Fortune 100, and the S&P 500. The information shows whether the balance sheet balances, whether the root economic entity could be found at all, and information about the fiscal period focus and the fiscal year focus.
All that information was obtained from the SECXBRL.info API using this very easy to use query. Looking at the parts of the query:
- Base query: http://secxbrl.xbrl.io/v1/_queries/public/api/facts.jq?
- Technical stuff:_method=POST&format=xml
- Concept: &concept=us-gaap:Assets
- Another concept: &concept=us-gaap:LiabilitiesAndStockholdersEquity
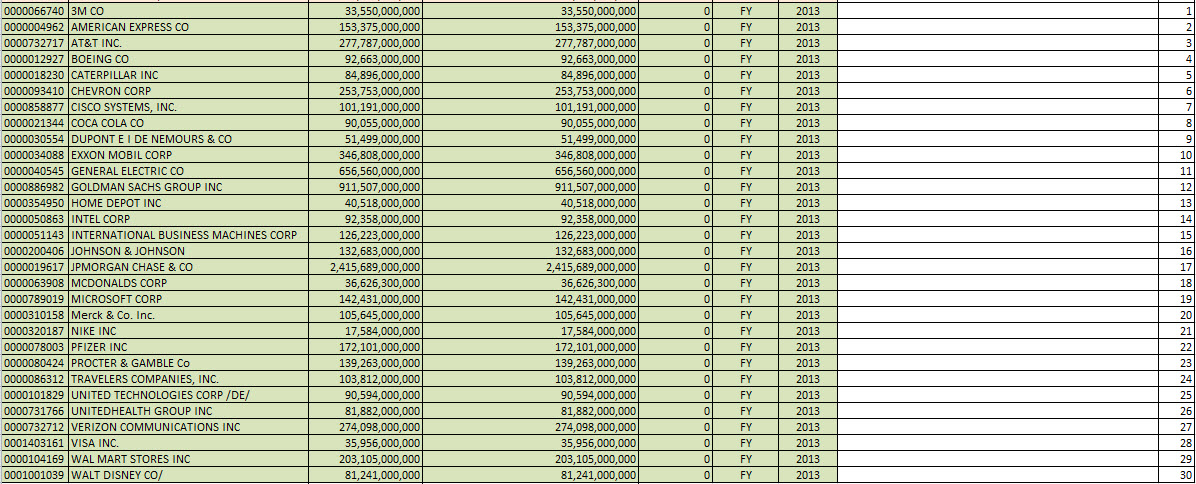
- CIK number: &cik=0000066740
- Fiscal period: &fiscalPeriod=FY
- Fiscal year: &fiscalYear=2013
You can fiddle with that by reading the API documentation, these example basic query examples which I created, or use this Excel application example to see how to write code.
# 3: Query hierarchical information
Most Excel users limit themselves unnecessarily. Excel is one tool, it is not the only tool. Microsoft sells another tool called Microsoft Access. It is a relational database. Excel is not a relational database. You can make Excel mimic what a relational database does to a degree using VLOOKUP or HLOOKUP functions. They get the job done in many cases, sort of. But if you understand how to use a relational database, such as Microsoft Access, you can do WAY, WAY, WAY more and doing it is substantially easier. Why? Because that is what relational databases do, they are really good at relating data.
Now, the same deal goes with Microsoft Access. It is one tool. While you can query hierarchical information using a relational database such as Access, it is harder to do that then using a tool which was built to do hierarchical queries.
So, the information within SECXBRL.info is laid out in terms of the meaning of the information. That information is represented in a lot of cases hierarchically. A relational query is not the best tool for doing a hierarchical query. You can do it, but it is not the best tool. You can pound a nail in with a crescent wrench, but a hammer works better.
The SECXBRL.info platform can do relational type queries, no problem. But they can also to queries across a hierarchy. The global standard XQuery is used for that. In fact, SECXBRL.info went two steps better. First, they use a third party extension of the global standard XQuery called JSONiq. That allows you to do lots of additional stuff such as use the JSON syntax if you prefer that over XML. Second, it has built in stuff to enhance query performance. I don't really understand that, multi-threading, load balancing, things like that. Personally, I don't care how it happens, I just enjoy the performance.
What this means is that you can write incredibly powerful queries which are beyond what most people today would even thing to query. I will write more on this later, but experience if for yourself by fiddling around with the "Compare & Search" functionality. I am not providing links because they are going to make some improvements to the GUI and so the links might change. Check back later, I will provide more information on querying hierarchies.
Bottom line
The bottom line here is that I can do way, way more poking and proding. Further, many others can also start poking and proding all those SEC XBRL financial filings. With the quantity and quality of tools increasing, it is going to be harder and hard for public companies, filing agents, software vendors, or others to get away with the poor quality filings that they have gotten away with in the past.
The quantity and quality of digital financial reporting tools will continue to increase. In fact, I believe that the pace of the increase will speed up.
 Charlie
in Becoming an XBRL Master Craftsman
|
Charlie
in Becoming an XBRL Master Craftsman
|
 Post a Comment
|
Post a Comment
|  Email
|
Email
|  Print
Print
Mitigating XBRL Report Element Misuse and Extension
An analysis of SEC XBRL financial filings contributed to identifying a set of seven minimum criteria which are necessary to make use of information reported in those filings. The notion of controlled flexibility was explained. Trying to connect that information with things that I am noticing in terms of report element misuse and inappropriate extension report elements from being created is my next step. I have identified the following five things which could mitigate misuse and inappropriate extension:
- Identify domain base classes, assign each taxonomy element to a base class: Categorize every report element into one business domain base category or class. The fundamental accounting concepts which I have created are a subset of the complete set of base classes. For example, a report element cannot be "assets" and be used as "equity". That makes no sense.
- Prohibit using report element defined in one base class as if it were some other class: Every report element must only be used to express something which relates to the intended base class. Said another way, report elements defined to be in one base class can never be used is if it were of some other class. Again, the concept "assets" cannot be used to express something which is "equity".
- Filer must identify base class of all extensions created: When a filer creates some extension report element, that report element must be associated with some base class or with some existing report element of the base taxonomy (which has been associated with some base class).
- Identify, articulate, and enforce computation relations between base classes: Unchangable computation relations exist between some base categories. Domain level business rules should enforce these computation relations. Again, the relations between the fundamental accounting concepts are an example of this. For example, why would it ever be the case that assets does not equal current assets plus noncurrent assets? (This is not about whether a filer actually reports noncurrent assets or if a filer uses an unclassified balance sheet, these are different situations which are handled by different rules.)
- Identify, articulate, and enforce allowed extension points: Some areas of an XBRL taxonomy are extensible. Other areas are not extensible. Where a taxonomy can and cannot be extended is up to the system which makes use of the taxonomy. This information must be clearly communicated.
So that is my first cut at trying to explain this. Most assuredly this needs more refinement, testing, and some examples to more crisply explain. It is trivial to include this information within an XBRL taxonomy using the power of XBRL definition relations to express this information.
I am not saying that my five points are suffecient to solve the problems of report element misuse or inappropriate extension. However, seems to me that they are necessary constraints in order to have quality reported information for use by analysts.
Any thoughts you might have would be greatly appreciated.
Charlie
in Digital Financial Reporting
|
Post a Comment
| Email
| Print
Understanding XBRL Definition Relations
This blog post summarizes information which is helpful in understanding one of the more powerful but under utilized features of XBRL: XBRL definition relations.
First, it is important to understand a few important things.
An important thing to realize is that information can be exchanged to the extent that the information is clear and usable by the computer which is making use of the information. This blog post about attaining high semantic clarity explains that statement in detail. A part of that semantic clarity is to provide some sort of classification system. Classification systems differ in the amount or level of information they provide.
Here is a summary of different types of classification systems in order to show the differences between the many types of classification systems:
- List: A list is just that, a simple list of things. A dictionary is an example of a list. All it does is provide a list of the "things" you are working with.
- Taxonomy: A taxonomy provides a list of the "things" you are working with just like a list, but it also provides "relations between the things". A taxonomy provides one or more sets of these relations generically in the form of some sort of hierarchy which articulates relations.
- Ontology: An ontology is similar to a taxonomy in that it provides a list of "things" and the "relations between the things". Ontologies tend to be more formal, more comprehensive. Ontologies provide representations of entities, ideas, and events, along with their properties and relations, according to a formal system of categories.
In essence, the difference between a list, a taxonomy, and an ontology is the thoroughness to which it expresses information about some domain which the list, taxonomy, or ontology describes.
There are all sorts of ways that lists, taxonomies, or ontologies can be created. There are four important factors to consider when you try and express the "things" and "relations between the things" in a domain.
- Expressiveness: First, the expressiveness of the scheme you are using. How capable is the method you want to use to express the things, the properties of the things, the interrelationships, the properties of the interrelationships.
- Standardness: Second, is the scheme you are using a global standard approach or is the approach proprietary.
- Human readability: The scheme you use to express information needs to be readable by the domain experts who can tell you if the things and the relations of things are accurate and by technical people who have to build software to interact with your representation. Human readablity is important when the information is initially created and also for maintenance of the information.
- Machine readability: Last but not least, the things and relations between things you express needs to be readable by computers who will make use of the information.
Many people who build formal, rich expressions of the information for a domain use OWL (Web Ontology Language) or RDFS (RDF Schema), both of which are global standards. One of the major problems with expressing business information using OWL or RDFS is that many times the business information is numeric and the relations between business information is computation related in nature and neither OWL nor RDFS handle the expression of that computation related information particularly well. To address that issue, the W3C created RIF (Rule Interchange Format) and a third-party created SPIN (SPARQL Interface Notation).
Most people don't realize that XBRL can also be used to create rich ontologies which express the things and relations between the things within a business domain. While most people understand how to express "the things" in the form of an XBRL taxonomy schema, general relations between the things using XBRL presentation relations, basic roll up computations using XBRL calculations, and to a lesser extent more complex computation and other types of relations using XBRL Formula; fewer people understand XBRL's power for expressing other sorts of relations.
Both a great example of what can be done with XBRL definition relations and additional semantics expressed by XBRL definition relations is the XBRL Dimensions specification. The XBRL Dimensions specification uses the power of XBRL definition relations to achieve its objective. One approach to learning about the power of XBRL definition relations is to reverse engineer the XBRL Dimensions schema. Check out the schema and check out XBRL definition relations provided in SEC XBRL financial filings and you can see how to wire things together.
Another way to learn about XBRL definition relations is to build something. This explains what I built.
The first thing you will want to do to express information using XBRL definition relations is to define the types of relations you will be expressing. This is done by defining an arcrole. Arcroles work like the predicate in an RDF-type subject-predicate-object relation. Defining an arcrole (predicate) is straightforward enough. Here are two examples which I defined: (both of these are prototypes)
- RDF-type relations and whole-part type relations: These are some RDF-type relations such as "class-subclass" and a set of different types of whole-part relations which I defined.
- Financial disclosure specific relations: These are some financial reporting specific types of relations which I created. I don't want to spend time explaining these relations right now, just consider these examples.
So again, defining the arcroles themselves are pretty straight forward. Understanding WHAT arcroles you need to create is harder.
A very important aspect of arcroles to understand is the XBRL Link Role Registry (LRR). Rather than have a bunch of different groups define arcroles which mean the same thing, there is a way to get your arcroles included in the global standard. These are existing arcroles which are in the global standard. The advantage of making your arcroles part of the global standard is that software support would likely be better and more consistent.
You can further describe information needed by your arcroles by putting properties on the definitionArcs. This is an XBRL taxonomy schema which I created with some made up properties.
Finally, I created relations between things and expressed those relations using an XBRL definition linkbase. The first definitionArc has the properties which I defined.
Now, XBRL definition relations work similar to the RDF-type subject-predicate-object scheme. In XBRL definition relations rather than using subject-predicate-object you use XLink (XML Linking Language) style syntax using from-arcrole-to. So by using XBRL definition relations and arcroles you define, you could basically redefine anything OWL or RDFS defines using XBRL.
If you want some additional examples, check out the financial report ontology. That contains plenty of examples.
A very good question would be WHY would you do this? Why would you define using XBRL what you could define using RDFS or OWL. Well, there are four primary reasons why I am doing this:
- RDFS and OWL are insufficient: RDFS and OWL are insufficient for expressing all the semantics which need to be expressed for the domain I am personally interested in which is financial reporting. I need to make use of XBRL calculations, XBRL Formula. So basically, my goal is to implement everything that I need and all that is necessary for what I need to achieve using XBRL syntax.
- Easier: I personally find this easier. The syntax is easier, the tools are easier to use. I have struggled, and struggled, and struggles trying to get the RDFS and OWL correct and I have not been able to achieve that goal.
- Flexibility: Syntax really does not matter. What is important is to get the semantics correct. If the semantics are correct, then the syntax which is used to express those semantics can be converted to any other syntax. Basically this boils down to flexibility. I would suspect that people who know RDF syntax can take the XBRL-based information and then convert that information into RDFS, OWL, or whatever format they might desire really.
- Standard: I want to avoid proprietary formats. There really is no point to reinventing some proprietary format if a global format works. I already have most of my information in a relational database already, moving to XBRL or RDF syntax, or any other syntax for that matter is a snap.
All this is like the wild, wild west currently. Who knows what syntax will be used in the future. Smart people are realizing the power of high semantic clarity in making machines serve humans, in attaining the quality level necessary, etc.
Charlie
in Becoming an XBRL Master Craftsman
|
Post a Comment
| Email
| Print
Need for New Global Standard Spreadsheet Alternative
This blog post attempts to synthesize and summarize the blog posts: Understanding Database/Query Options Part 1, Part 2, and Part 3. If you are reading through this and desire additional details, go to those three parts, the details are there somewhere. This information leads me to the belief that a new global standard spreadsheet alternative would be a good thing.
We live in the information age which is a result of the digital revolution. The volume of information is growing at an exponential rate. The majority of that growth is expected to be in the form of structured information. This graph below shows one projection of the growth of structured information:

An increasing number of people are referring to all that data as "Big Data". Sometimes people use the term big data to describe large data sets, other times they use it to describe the exponential growth and quantity of data.
This is my explanation of big data:
BIG DATA is the notion that you no longer have the luxury of treating one database as 'the database' and putting all of the information you have into that one database. Data that you need exists within your organization and external to your organization. The data varies in the representation structure/style (table-type, tree-type, graph-type). It varies by system (Windows, Mac, Linux, etc.). It varies by format: Excel, email, RDBMS, RDF, CSV, etc. The applications used to manage the data vary. Some data is unstructured, an increasing amount is structured. The volume of information is high and it is getting higher. This information is an asset which should not be squandered. The velocity which data grows is increasing rapidly. Some of the information changes rapidly. Some of the data is generated by machines faster than humans can consume it.
The cause of this explosion in information, more and more computers in an ever increasing networked world, is also the solution to the problem. We need the machines to help humans create or use this information asset. Help from machines will reduce costs of using this information asset, reduce the time needed to make use of this asset, and increase the quality of the information asset.
People are generally not really interested in data, per se. They are interested in what you can do with the data. They want to understand data relative to other data, to compare information.
- Data is the most basic level; discrete facts or observations, but unorganized and unprocessed and therefore has no real meaning or value because it has no context; for example, "10,000" is data.
- Information adds context to the data; information is data in context, it has meaning; for example, "Sales for ABC Company for 2012 is $10,000 is information.
- Knowledge adds how to use information to the equation; knowledge is a framework for evaluating and interpreting information which makes use of experience, values, expert insight, intuition with the goal of evaluating and incorporating new experiences and information; for example, the sales for every public company organized in useful ways is knowledge.
- Wisdom adds when to use knowledge; wisdom relates to knowing why and doing something useful; wisdom = knowledge + experience; for example, exercising judgment to sell your shares of some stock because the sales relative to the sales of other public companies and relative to other numbers on a financial statement is wisdom.
To get a machine such as a computer to interact with something in the real world you must express things in a form a computer can understand. Something that is both understandable by humans so that the humans can be sure it is right and understandable by computers enables a computer to help humans perform work. The more a computer understands, the more a computer can do for humans. The more clarity this computer readable information holds, the more successful multiple computers will be in sharing and effectively using the shared information.
These machine readable representations, sometimes called conceptual models or domain models, are more information. The machine readable representation distills down to the important "things" which exist within some business domain and the "relations" between those important things. These machine readable representations of a business domain can be more formal or informal. The representations can have a high level of information about the business domain or a low level of information. The representations can be global standard representations or they can be proprietary representations. Achieving high-semantic clarity or a lower-level of semantic clarity is a choice which is made by a business domain. The choice is based on what the business domain needs the system to do.
These relations between the things of a business domain tend to be highly-structured or semi-structured.
There are three primary formats for representing/modeling these highly-structured and semi-structured information. Each representation approach has pros and cons. Each of these formats has a standard query language:
- Table-type representation - queried using SQL
- Tree-type representation - queried using XQuery or JSONiq
- Graph-type representation - queried using SPARQL
Each of these representation approaches is 100% interchangeable. The key to performace is the indexing scheme, not the information format. Each of these formats has an indexing scheme.
Different database management systems are used to manage these different representation/modeling approaches. Some representation formats fit better into some specific types of database management system. Each database management system likewise has pros and cons for representing information. These pros and cons tend to distill down into the following constraints which must be considered (i.e. other constrains may need to be considered based on some specific situation, but these constraints generally should always be considered):
- Ease of use for business users (as business users manage this information, not IT people)
- Level of query power and sophistication
- Query performance, speed
- Initial system cost and ongoing operating cost
- System management and maintenance cost
- Ability to interoperate with other business systems internal or external to organization
- System flexibility, agility, adaptability by business users, not the IT department
- System scalability
There can be a need to make tradeoffs if a system cannot meet 100% of these constraints. Historically systems seemed to be stratified by the two primary categories: online transaction processing (OLTP) and online analytical processing (OLAP).
Another extremely popular system is the electronic spreadsheet, particularly the very popular Microsoft Excel. But spreadsheets have issues. The disadvantages of spreadsheets are well understood. How to solve the problem of spreadsheets, which has been referred to as "spreadsheet hell", is less well understood.
Now, OLAP systems are increasingly making use of spreadsheets to allow business users to interact with information contained in OLAP systems using spreadsheets or pivot tables. People are building other tools to fight the symptoms which are experienced by the users of spreadsheets.
But none of these approaches is solving the real problem of spreadsheets, they only fight the symptoms which business users and IT departments experience. What if spreadsheets were totally reengineered? What would the requirements be?
Well, here is my summary for the requirements of a better spreadsheet. This new improved version of a spreadsheet is not intended to replace 100% of all existing spreadsheets. Rather, this is intended to be a new alternative, a new category of spreadsheet. An alternative which could be used in 20% of the cases where more control is needed over spreadsheets.
- Readable by both humans and machines: A spreadsheet should be readable by both humans and machines. Information provided within a spreadsheet should be more a representation of information than presentation oriented. The representation can be presented in sheets, rows, columns, and cells but this is done leveraging information metadata and commonly understood patterns. 100% pixel perfect renderings are specifically not a requirement.
- Global standard format: The format of the spreadsheet should be a global standard, not controlled by one software vendor.
- Agreed upon level of semantics: The creators and consumers can agree on the level of semantic clarity they will make use of for a spreadsheet. The spectrum can range from no semantics at all (which is similar to today's spreadsheet) or a high level of semantics expressed by a highly controlled representation model.
- Separation of representation and presentation: The "representation" and the "presentation of the representation" should not be intermingled.
- Business rules separable from spreadsheet: Business rules should be separated from the information when desired, integrated with the spreadsheet when necessary. Business rules which are external to the spreadsheet can be used to "watch over" the things and relations within the spreadsheet. The business rules can be made available publicly via a URL, privately via a private URL, etc.
- Managed global standard: The better spreadsheet should be a global standard under the control of someone like OMG, XBRL International, ISO, Apache OpenOffice, or some other such organization.
- Provide a formal shape but be domain neutral filler: One formal shape should be agreed to, for example the multidimensional model, but the pieces which fit into that shape or "fill" the shape are domain neutral, controlled by the business domain.
- Format should allow for versioning, collaboration, etc: The syntax format should allow for ease of versioning, constructing systems which are collaborative in nature (multi-user).
- Straightforwardly usable over the Internet: The format should be compliant with internet standards.
- Support a wide variety of common business use cases: A wide variety of common business use cases would be served, but it is not a goal to solve every business problem which exists.
- Highly limited options: The number of optional features is to be kept to the absolute minimum, ideally zero. Multiple approaches to solving a problem are not necessary when one will do.
- Formal and concise design: The design must be formal, concise, well designed and well engineered.
The spreadsheet I am describing is somewhat of a "micro system". It allows business users to construct robust systems using what amounts to well engineered Lego-type building blocks created by IT professionals. This avoids or reduces information rekeying. This avoids or reduces the ever expanding "point solutions" which are created using spreadsheets. These micro sytems also will easily integrate into larger business systems.
I cannot really take credit for any of these ideas. I am simply summarizing the ideas of others into one consolidated list. There is a tremendous amount of information here. The best way to get your head around this information is to read this blog post, go read through the details of the other three blog posts mentioned at the beginning, and then read this blog post again.
Is this achievable? Is this even useful? What do you think? Personally, I believe XBRL is already this standard. Go look at SEC XBRL financial filings. Each report component is a spreadsheet.
Charlie
in General Information
|
Post a Comment
| Email
| Print

