BLOG: Digital Financial Reporting
This is a blog for information relating to digital financial reporting. This blog is basically my "lab notebook" for experimenting and learning about XBRL-based digital financial reporting. This is my brain storming platform. This is where I think out loud (i.e. publicly) about digital financial reporting. This information is for innovators and early adopters who are ushering in a new era of accounting, reporting, auditing, and analysis in a digital environment.
Much of the information contained in this blog is synthasized, summarized, condensed, better organized and articulated in my book XBRL for Dummies and in the chapters of Intelligent XBRL-based Digital Financial Reporting. If you have any questions, feel free to contact me.
Entries from November 1, 2011 - November 30, 2011
Thinking about XBRL by Looking at M2M
M2M (machine to machine) is defined well by Numerx as:
M2M communications employs a device (e.g., sensor, meter, etc.) to capture an "event" (e.g., temperature, inventory level, location, environment status, etc.), which is relayed through a network (e.g., wireless, wired or hybrid) to an application (software program), translating the captured event into usable information (e.g., there is a breach, corrosion requires attention, items need to be restocked, an accident has occurred, etc.)
Familiar companies such as Sprint, AT&T, Verizon, IBM; and other lesser known companies such as Numerx and Axeda push M2M. By at least one prediction, trillions of machines are just waiting to join the M2M party.
Even Google seems to be getting into M2M. This article has a section titled Will Google Flush M2M Down the Crapper?. This section of the article below mentions some things which might bring to mind statements you have heard when people talk about XBRL:
"It's going to raise the awareness of M2M. When executives in the board room say 'I see Google connected a smartphone to a dishwasher, why can't we connect to our equipment or our products?' it's going to raise the visibility of what you can do.
"What Google is going to find out is that connecting is pretty hard, a lot of devices aren't serving data that's usable. There is a need for a layer that turns the raw available data into usable data like temperatures, etc. into a data model that programmers can use.
"That's our secret sauce, our unique value proposition: our technology converts raw data into business data.
"It comes in obscure message format packets, with headers etc. we've got a whole set of parsers and translators that turn that into an asset, temperature. We have a rules engine that allows you to create notifications, web services layer available by REST, can do mashups with HTML or javascript."
So what does connecting a smartphone to a dishwasher or having SIRI start your car have to do with XBRL? In a word: lots.
Millions and millions, if not billions, of business reports are shared within and among businesses and governments. Those business reports are packets of information. Maybe they are a little more complex than M2M communications, but basically it is the same idea.
XBRL is part of what will enable business-to-business, business-to-government, and government-to-government digital business information exchange.
Most of the traction XBRL has been able to create thus far is business-to-government information exchange such as banks reporting to a regulator such as the FDIC or one of the 27 CEBS supervisors, public companies reporting to the SEC or a stock exchange, corporate tax reporting to HMRC or National Tax Agency of Japan, or Standard Business Reporting (SBR) type projects in the Netherlands and Australia. Those are only some examples.
But what about some of these use cases:
- I used to work for a lumber manufacturer. As you can imagine the manufacture used a lot of equipment in the process of cutting lumber to spec; resaws, dry kilns, plainer, etc. What if the equipment could "talk" to the accounting system, publishing the production statistics which I had to enter manually for each of those machines each day. What if the accounting system could then send that to each manager's cell phone like real time stock information or the weather is provided today. Basically, what if you could inexpensively create your own real-time information feed?
- I used to work for a produce broker. We had a vacuum cooler which brought the temperature of the lettuce from field temperature down to storage temperature. A person had to man that machine and occasionally they would loose their focus and a $10,000 load of lettuce would be rendered unusable because the operator neglected to do his duties. What if the vacuum cooler could send alerts to the operator if a setting went out of bounds. Basically, what if you could create your own real-time monitoring system inexpensively?
- A friend of mine is a chiropractor. She got a new practice management system and she loves the daily reports which the system spits out. The receptionist prints the reports generated by the system, reorganizes them, and then emails a PDF with this management information to my friend so she can keep tabs on her business. What if that entire process could be automated or if other additional useful reports could be sent, without the receptionist or other person getting involved in the process, totally automating the report distribution process?
- I heard a story on NPR about how schools spend a lot of money on electricity. Leaving the football or soccer field lights on when no one is using the field is both a waste of money and a waste of a resource. Having usage patterns reported, tracked, and managed can help save money and reduce electricity use. What if you could do this for the many different devices businesses and governments use in their operations?
I could go on and on, there are plenty of these types of use cases if one really looks.
Imagine an inexpensive, easy to use, robust, reliable, error-free, scalable, secure, auditable, understandable (from a business semantics perspective); basically truly automated business-to-business, business-to-government, or government-to-government. What processes could you make better, faster, or cheaper in some way?
These processes could be within your organization or there your internal processes intersect with one of your business partners.
 Charlie
in General Information
|
Charlie
in General Information
|
 Post a Comment
|
Post a Comment
|  Email
|
Email
|  Print
Print
SEC Provides Easy to Use Link to SEC Filings
It used to be the case that it was a huge challenge for the average person to grap SEC XBRL financial filings from the SEC web site. An RSS feed was provided for the last 100 filings.
No longer. The SEC is providing an archive of filings by month! You can get to those archives here:
http://www.sec.gov/Archives/edgar/monthly/
The format of each archive is simply an RSS feed. You can read through those filings with anything which will read XML.
Thank you, thank you, thank you SEC!
By the way, for those who like dinking around with stuff, there is a boatload of information which can be accessed using FTP. See here for more info: http://www.sec.gov/edgar/searchedgar/ftpusers.htm
Charlie
in General Information
|
Post a Comment
| Email
| Print
Human Readable Rendering is the Creation Interface for XBRL
I have been exprimenting with how to get from an XBRL instance to a human readable rendering since about 2007 I figure. What if these same techniques in the creation of business reports(i.e. the XBRL)?
When working to create XBRLS the notion of a "neutral format template", or a basic rendering came to mind. Then the idea that a business report is nothing more than a bunch of pivot table-type objects. Then I thought that BI (business intelligence) software could be used as an interface, but BI had limitations: it forces OLAP on you, it does not handle text well, and it is really meant for read only not read/write. Over the years I have used other terms to refer to the notion of a neutral format template: neutral format table, interactive business document, interactive information hypercube.
Here are some examples of what these neutral format templates look like:
All the information that I have seen can be condensed down into about nine metapatterns. Here renderings of each of the nine metapatterns: hierarchy, roll up, roll forward, compound fact, adjustment, variance, complex computation, text block, grid(not really a metapattern, but it is used in the US GAAP taxonomy). Believe it or not, everything that exists in the US GAAP taxonomy and everything that I have seen in SEC XBRL financial filings fits into one of these nine metapatterns. What if I am wrong? What if there are more than nine? Fine, add some more; maybe there are 15 or 25 or maybe even 50 metapatterns. The point is: the information is not random, there is a pattern!
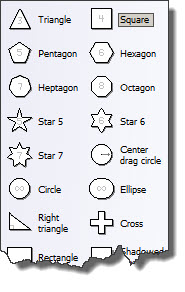
The idea of leveraging patterns or metapatterns or templates to make working with computers is not my idea or even a new idea. For example, look at these Microsoft Visio shapes or stencils. What is easier to create: (a) a triangle by dragging and dropping the shape/stencil or (b) a triangle by building the triangle yourself from lower level objects?
These same ideas apply to working with XBRL. Below is one screen shot of a neutral format table, you can see a complete set here.
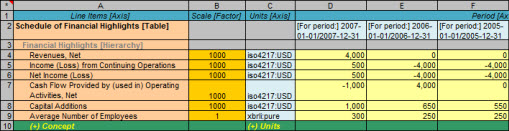
Clearly I am not an artist and my color selection is poor; but what if creating an XBRL instance and XBRL taxonomy was as simple as editing that table. It guides you through the process of "extending" a taxonomy. It only lets you extend the taxonomy where it is logical.
Just like creating that triangle in Visio by dragging and dropping an existing triangle and adjusting the properties such as its size (rather than drawing each line and connecting them correctly, etc.); a financial statement is a collection of stencils or templates or tables. You can modify the stencil, adding line items to your balance sheet. The template will not let you change the fundamental nature of a balance sheet: all balance sheets have certain characteristics, core financial semantics. Those core semantics, which each template has, are expressed using business rules (XBRL formulas) and they "glue" the information set together.
So, why can't this work? If a human readable rendering can be generated using the information contained within the XBRL instance and XBRL taxonomy and the information about the nine fundamental metapatterns (or whatever number we come up with) is leveraged to render that information correctly; then why can't that same rendering be used to create the business report and then generate the XBRL output (and HTML, PDF, Excel, Work, or whatever other format you might care for)? The business rules such as those core financial reporting semantics hold the pieces together and software won't let you break those core rules.
Or do people really enjoy working at the level of the XBRL technical syntax?
Getting from Fact Table to Human Readable Rendering
This is the third installment of three blog posts which go together. The first to help you understand this third post. The first blog post helped you see that [Axis] articulate characteristics of a fact and that you can organize a set of facts into a fact table. The second blog post builds on the first, helping you to better see how fact tables work.
The final piece of this puzzle is turning that fact table into something useful to a human. This process is detailed in this document, From Fact Table to Rendering. Below I will summarize the key points (and I am not showing all the graphics, see the PDF for those).
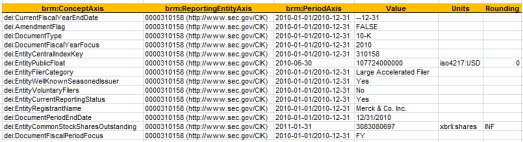
Step 1: Basic Fact Table. Here we have a basic fact table. (If you don't understand this, please go back and read the two blog posts which are pointed out above.)
The facts are in the rows. The [Axis] are in the columns. The Value is the value of the fact, the units show the units of the value if the value is numeric (most people don't consider this an [Axis], some do), and the rounding explains how many decimal places the fact has. For the purposes of this exercise we will ignore the units and rounding.
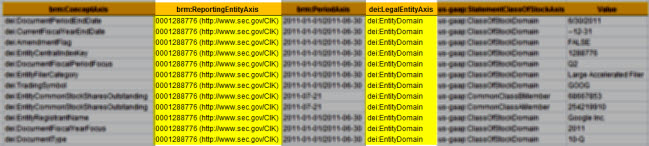
Step 2: Identify Slicers. A slicer is an [Axis] which has the same value or [Member] for each fact. For example, the ReportingEntityAxis and the LegalEntityAxis is the same for each fact. What we do with slicers is move them in the upper left hand corner (using my rendering model).
Step 3 Repositioned Slicers. In the PDF you can see the repositioned slicers. Basically, the slicers apply to each of the facts and they are the same for each fact. Slicers serve another role which is to filer facts, but we won't get into that here.
Step 4 Identify Columns. The next step is to identify the columns of the rendering. Different portions of a report have different conventions for rendering. You could render or present the information however you like. But conventions are good because they help software pick an appropriate option if options exist. So, we will follow the SEC interactive information viewer convention as it will meet our needs here. We look at the two [Axis] with the SEC put into the columns, the period [Axis] and the class of stock [Axis]. The colors show the different values or [Member]s for these [Axis].
Now, this would be a lot easier if there were only one [Axis] which went in the columns, but I wanted to show to so you can get an appreciation for how to think through this process. Also note that you have two concept [Axis] which are the same and have the same period; the only differentiator is the class of stock [Axis].
Step 5 Rendered Columns. Without trying to overdue the explanation, this is what the rendering of the columns look like (see the PDF) for the first iteration where each of the two [Axis] is placed in the column heading, and the values which have those characteristics are placed in those columns for the rendering.
Step 6 Organize the Rows. Next we order the rows. We could do that alphabetically, we could use the taxonomy presentation order, or we could frankly use whatever ordering you wanted; the easiest and what the SEC viewer uses is the taxonomy order.
Step 7 Tidy Things Up. And finally we tidy things up by pulling the "Document Information [Line Items]" concept from the taxonomy to hang the other concepts off of (providing organization), we grab the taxonomy labels because they are easier on the eye than those names, use whatever other colors we want, format to your heart's content.
Step 8 Leverage Information model. For some renderings understanding the information model helps you get the correct rendering. A good example of this is the roll forward. Different XBRL rendering engines leverage the information to a greater or lesser degree. The PDF shows a well rendered roll foward, and a Firefox add in rendering which is not that great. The SEC viewer understands how a user typically wants to view the roll forward information model and the Firefox add in does not, thus the funky rendering.
Most rendering engines get the roll up and hierarchy information model metapatterns correct, but not the roll forward or other information model metapatterns.
For more known metapatterns see: http://secxbrlglossary.wikispaces.com/Information+Model
So that is how we get to this:
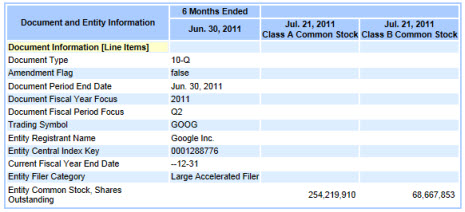
Not too bad.
A good question to ask yourself might be why can't the rendering within a creation tool look similar to this, basically allowing you to create or edit something like an SEC XBRL financial filing in a "what you see is what you get (WYSIWYG) style? I am NOT talking about editing HTML and then tagging that HTML with XBRL. I am talking about not even needing to "tag" anything. There is no tagging.
In a future post I will discuss semantic structured model-based authoring of financial statements and why you want that.
Business Report Tool Worth Checking Out
This business reporting toolis worth checking out. The tool is the APEX XBRL Maker 2011 and is created by Saltlake Infosolutions which says the tool is built to use the taxonomy created by Ministry of Corporate Affairs, Govt. of India.
I installed the application and installed some .Net 4.0 component I needed, and the application was up and running. The interface still needs polish. I entered some required information (probably about 10 things) and then generated the XBRL instance.
Frankly, I wish people would get away from the term "extended link" which is used by this application and use the proper semantic term "network" at a minimum, but even better something such as "section" which is far, far easier to relate to.
While this application does not appear to allow extension of the taxonomy, one can imagine that adding a row or a column to the existing interface would be workable for business users.
Certainly worth checking out.
If you hear of other good software applications or if you are a software vendor and have a good software tool and want people to be made aware of it, send me an email.
Charlie
in Demonstrations of Using XBRL
|
Post a Comment
| Email
| Print

