BLOG: Digital Financial Reporting
This is a blog for information relating to digital financial reporting. This blog is basically my "lab notebook" for experimenting and learning about XBRL-based digital financial reporting. This is my brain storming platform. This is where I think out loud (i.e. publicly) about digital financial reporting. This information is for innovators and early adopters who are ushering in a new era of accounting, reporting, auditing, and analysis in a digital environment.
Much of the information contained in this blog is synthasized, summarized, condensed, better organized and articulated in my book XBRL for Dummies and in the chapters of Intelligent XBRL-based Digital Financial Reporting. If you have any questions, feel free to contact me.
Entries from November 1, 2014 - November 30, 2014
Understanding Report Frames
I have mentioned the idea of report frames a while back. I don't know if report frame is the appropriate word to use, but that is the best word I have come up with so far. Explaining report frames will help you understand exactly what they are.
One of the problems with the fundamental accounting concepts and the relations between those concepts (old version) is that there was only one set of fundamental accounting concepts and one set of relations. The reality is that there are a number of sets of concepts and relations.
Now, this does not mean that any of the existing relations are invalidated. And it does not mean that the original set is not useful. The original set is very, very useful to the 85% of companies who are commercial and industrial companies who follow the most common approaches to reporting their financial information. But what about the other 15% that are not commercial and industrial companies? What about the license reporting entities have under US GAAP to be flexible?
Here are three examples of what I mean by report frames: (the nice renderings are complements of XBRL Cloud)
- Commercial and industrial company which reports using a multi-step income statement
- Interest based revenues used by a bank
- Insurance based revenues used by an insurance company
An economic entity reporting under US GAAP has some artistic license to tell their story their way. But this artistic license is not infinite nor is it random. You are not going to find any (or many I should say many) commercial and industrial companies reporting using an unclassified balance sheet. Why? Because the reporting rules state that you MUST provide a classified balance sheet which breaks out assets and liabilities into their current and noncurrent portions. But banks and insurance companies do provide unclassified balance sheets, not breaking out current and noncurrent assets and liabilities.
If you look at the income statements of the three examples, that is where most of the differences are. In fact, the most differences are within the section before "Income (loss) from Continuing Operations Before Tax". If you look at the balance sheets and cash flow statements, they are all very similar accept for the classified or unclassified assets and liabilities.
How many report frames are there? Well, I don't know. But I am going to find out. My best guess right now can be seen here in this index of report frame codes. I grouped my test set of 6,674 public companies into 122 report frames. But about 50 of those report frames have only 1 or 2 reporting entities. About 86% of reporting entities fit into 10 report frames.
What I can guarantee is that every reporting entity will fit into a report frame. Some of those report frames might have only one reporting entity. A handful of report frames will have the majority of reporting entities.
The aspect of digital financial reporting that I am looking at here is driven by common sense, rational thinking, empirical evidence, logic, and so forth. There is zero judgement involved. This analysis is about observing what a public company is doing, comparing what they are doing with what others are doing, and noting consistencies and inconsistencies. Basically, if there is no specific explainable reason for something to be inconsistent; then why would it not be consistent?
Now, the judgment comes in the next layer of analysis. So, for example, I pointed out the variability in how public companies report income (loss) from equity method investments. Is that variability useful or a problem? Well, you tell me. That requires professional judgement. I, personally, have enough professional understanding understand that line item to a degree; but I do not have the professional understanding to make the call as to whether all those options public companies use make sense. There are some accountants that I have talked to who say "income (loss) from equity method investments MUST ALWAYS BE REPORTED AFTER TAX!!!" They insist that is the only alternative. Clearly that is not the only alternative if public company financial reports don't all report using that approach.
Now, I don't know why the variablity exist. But I do know that asking WHY this variability is necessary is a very good question. Was the variability:
- a conscious choice allowed by those creating the reporting standards?
- an unintended mistake caused by not paying enough attention to details?
But I can tell you this. You will not find income (loss) from equity method investments reported as part of current assets. It will never be included in net cash flow from financing activities. That is not where it goes. Extreme example? Yes. To make a point. The relations between concepts follow logical, rational, sensible rules of US GAAP. Most of these rules are not disputed. Some are disputed. Some "artistic license" is allowed by external financial reporting managers. Some is not.
Machines can do a really good job of checking stuff what is not in dispute. You simply need to put the rule into a form that a machine can understand, and then the machine can do really useful things. The fundamental accounting concepts are just the tip of the financial reporting iceberg.
Check this out: Future minimum payments under capital leases
These ideas apply to disclosures also. Think automated disclosure checklist. How much can be automated? Well, I don't know. But I will find out.
 Charlie
in Becoming an XBRL Master Craftsman
|
Charlie
in Becoming an XBRL Master Craftsman
|
 Post a Comment
|
Post a Comment
|  Email
|
Email
|  Print
Print
Understanding Cell Stores and NOLAP, the Future of the Spreadsheet
Ghislain Fourny of 28msec, creators of SECXBRL.info, came up with the notion of the Cell Store which he describes in a paper he wrote on the subject. He describes a cell store as:
Cell stores provide a relational-like, tabular level of abstraction to business users while leveraging recent database technologies, such as key-value stores and document stores. This allows to scale up and out the efficient storage and retrieval of highly dimensional data. Cells are the primary citizens and exist in different forms, which can be explained with an analogy to the state of matter: as a gas for efficient storage, as a solid for efficient retrieval, and as a liquid for efficient interaction with the business users.
The XBRL standard helped to inspire the idea of the cell store. One thing that the paper does not mention but should have mentioned is the XBRL Abstract Model 2.0. The XBRL Abstract Model 2.0 basically articulates the high-level semantic model of a business report.
There are a handful of other adjustments that I would make to the Cell Stores paper.
First, the paper is not clear enough on how business rules are used to both enforce quality and enforce semantics between cells. Cells can be related to other cells. Part of the power of a cell store is the complexity of what can be represented. A perfect example of this is public company financial filings. Those are complex documents with many, many complex relations. Fundamental relations such as "assets = liabilities and equity" and more complex relations. These business rules are critical because they keep the information quality high. But the business rules provide something else: increased reasoning capacity of software applications.
Second, the notion of "concept arrangement patterns" and "member arrangement patterns" are not explained well in the paper and some errors exist. This is partly my fault. These names have changed (from pattern, to metapattern, to accounting concept arrangement pattern, and finally to concept arrangement pattern). These relations exist and they are critical to making this system work correctly. The notion of a "whole-part" relation is left out all together.
Third, the paper says that these concept arrangement patterns and member arrangement patterns exist "according to me". That is not the case. What I have done is observed and documented. These patterns exist in SEC XBRL financial filings. It is those financial reports that state that these patterns exist. I simply made the observation and wrote the information down. Empirical evidence proves that these relations exist, not my opinion.
Finally, the paper points out very clearly that XBRL enables the interchange of "data" between different systems. What the paper does not point out clearly enough is that not only can you exchange "the data" but you can also exchange "the model", the metadata. This is a crucial distinction. Which brings us to NOLAP.
Another notion that Ghislain came up with was NOLAP. NOLAP, which is explained in the Cell Store paper and which I explain here, overcomes issues with OLAP. Here is a summary of issues with OLAP:
- There is no global standard for OLAP
- Cube rigidity
- Limited computation support, mainly roll ups
- Limited business rule support and inability to exchange business rules between implementations
- Inability to transfer cubes between systems, each system is a "silo" which cannot communicate with other silos
- Inability to articulate metadata which can be shared between OLAP systems
- Focus on numeric-type information and inconsistent support for text data types
- OLAP systems tend to be internally focused within an organization and do not work well externally, for example across a supply chain
- OLAP tends to be read only
Over the years I have mentioned the notion of a "semantic spreadsheet". NOLAP (not only OLAP) is essentially the same thing as my idea of a semantic spreadsheet. This video of the application Quantrix is the closest visual that I have of what a semantic spreadsheet is and how it might work. (Here are more videos)
But Quantrix has issues:
- It is OLAP, not NOLAP
- The format is proprietary, not a global standard
- Quantrix does not understand domain semantics, only report level semantics
I point out these issues not to knock Quantrix, but to point out what NOLAP needs to be. Imagine a ubiquitous spreadsheet format (i.e. not owned by Microsoft) that works within Microsoft Excel, Google spreadsheet, Apple Pages, OpenOffice, connected to relational databases, other proprietary applications, etc.
The application is not like a normal spreadsheet which is "glued" together presentationally with the notion of a workbook, worksheet, row, column, or cell. The spreadsheet is glued together with meaning. Because the spreadsheet is glued together with meaning, in order to understand how to use it you only need to understand the meaning. The spreadsheet acts more like a pivot table. The pivot table is read/write. Information is stored not locally (although it could be, that format would be XBRL), but within a cell store. Or, the information could be taken out of one cell store and transferred into another cell store internal to your organization or external to your organization.
Folks, you don't have to imagine this. You can experience this, right now, today. Call me crazy, but the XBRL-based EDGAR system of public company financial information is exactly that. But there are some issues.
There are some details that are not quite working as they need to work. OK fine, fix the issues. Here are the issues and how to fix each issue:
- Performance: Querying the SEC EDGAR system information is not performant, it is simply a bunch of files within a file system. THE FIX: Put the files into a cell store or some other database.
- Information quality: The quality of the data of XBRL-based financial filings is poor. However, it is improving and it can be improved even more by using more rules. The rules keep the relations between the cells, the information, correct. THE FIX: Add more rules where the information is incorrect to force it to be correct.
- Creation software: Most software vendors made two mistakes in creating software for creating XBRL-based public company SEC filings. (a) The software is too hard to use because it was not built correctly and (b) the software vendor took a myopic view and made the software ONLY work with SEC filings. THE FIX: Build better software and make the software work with XBRL-based SEC financial filings, but not ONLY with SEC XBRL-based financial filings.
- General profile: Six years ago, Rene van Egmond and I pointed out that XBRL implementations are not interoperable. No system uses all aspects of XBRL. However, there is no real "application profile" defined which can be used to create "general" XBRL-based semantic spreadsheets. You have specifications for creating an SEC filings, you have all the rules for that. Those rules come from the US GAAP itself, the US GAAP XBRL Taxonomy and the SEC Edgar Filer Manual (EFM). Someone defined that profile. THE FIX: Create an agreed upon "general profile" which software vendors can implement, for example this is a general profile that I created which is based on and leverages the good aspects of the US GAAP XBRL Taxonomy Architecture/SEC system architecture, but overcomes the bad aspects.
Maybe I missed a few details. But that is all they are, details. I count 22 software vendors who already support the creation of XBRL-based SEC financial filings. 28msec already has a database. There are several other databases that I am aware of. XBRL Cloud has the validation capabilities, see their EDGAR Dashboard. There is already analysis software. What is missing is (a) software vendors collaborating to put these pieces together and (b) an understanding of the existence of a general application profile for doing this.
Companies that don't innovate risk becoming extinct. Do you want to take that risk?
Charlie
in Modeling Business Information Using XBRL
|
Post a Comment
| Email
| Print
Mastering Digital Financial Report Disclosures
While comparing and contrasting the fundamental accounting concepts reporting entities use helps you understand and verify basic relationships which are generally reported on the primary financial statements; the same ideas apply to disclosures. This blog post will help you understand how to understand disclosures within a digital financial report such as an SEC XBRL financial filing.
Take the disclosure future minimum payments under capital leases. (Here is documentation which provides details of this information provided below; here is an Excel spreadsheet with the summary.)
In order to understand this disclosure I looked at the Fortune 100 companies which provided the disclosure future minimum payments under capital leases. There were 35 entities in the Fortune 100 which provided that disclosure. (The other 65 don't have this disclosure because they don't have capital leases.)
Of those 35 entities which have this disclosure I will use Delta Air Linesbecause they were one of 21 entities which I believe created a logical, rational, sensible representation of this information. So 60% of those 35 entities represented this information consistently in all aspects and also consistent with what US GAAP says as I understand it.
First, they will provide a Level 3 text block with this disclosure as required by the SEC. They will also provide a Level 1 text block, but I am not analyzing that, only the Level 3 text block and the Level 4 detailed disclosure. Here is that Level 3 text block for Delta: (us-gaap:ScheduleOfFutureMinimumLeasePaymentsForCapitalLeasesTableTextBlock)
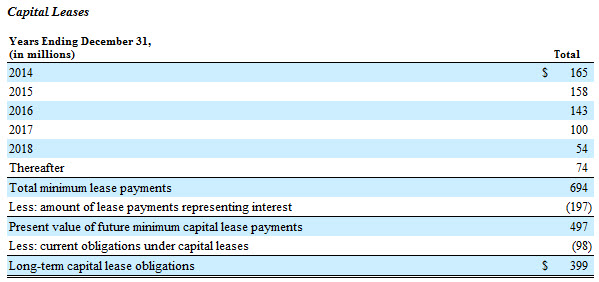 (Click image for larger view)
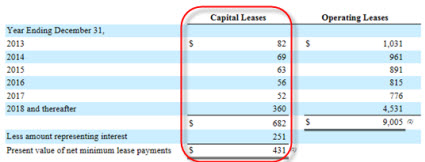
From the analysis you will note that only 6 other entities which reported this disclosure used that concept. There were 24 entities which created an extension concept. Why? Well, because (a) they combined the presentation of the capital lease and operating lease future minimum payments disclosure and (b) there is no text block concept for that combined disclosure. That seems to indicate, perhaps, that there is a concept missing from the US GAAP XBRL Taxonomy.
So, here is what the combined disclosure looks like (using American Airlines):
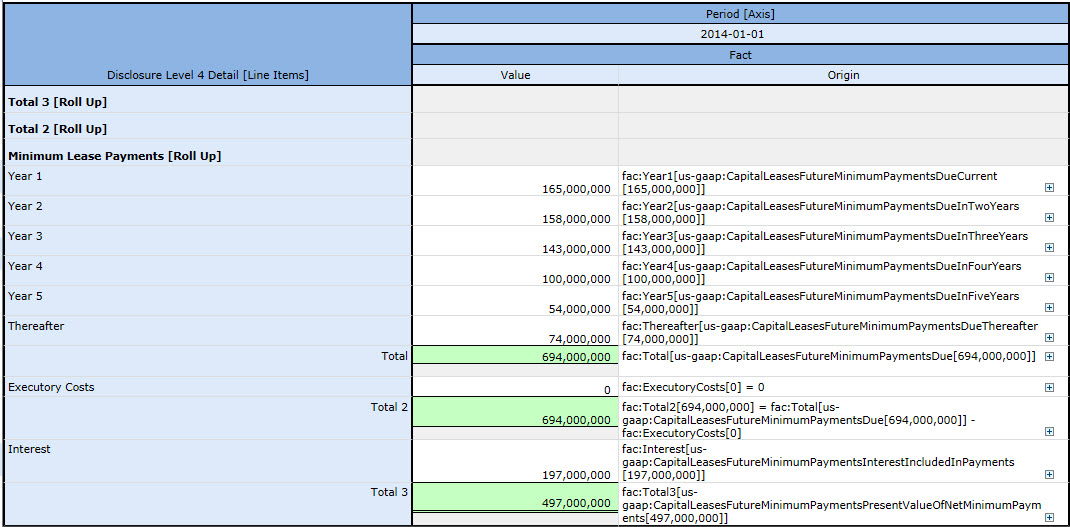
OK, back to Delta. They also need to provide a Level 4 detailed disclosure. Here is that information:
 (Click to view larger image)
Notice that the numbers in the detail match the numbers in the text block. But that is not all of the numbers. Notice that at the bottom of the Level 3 text block there is a current/noncurrent breakdown of the total capital lease obligation. I show that separately, here is that part of the disclosure:
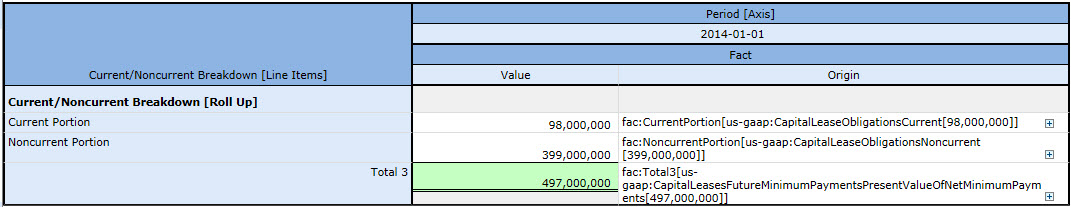 (Click image for larger view)
The reason I separate this is that personally, I consider this two disclosures. The first disclosure is the future minimum payments under capital leases. The second disclosure is the breakdown of the current and noncurrent portions of the total capital lease obligation. Sometimes the current/noncurrent breakdown ties to the balance sheet line items. Sometimes, as in Delta's case, it does not. Other times this can tie to other things.
This new tool provide by XBRL Cloud can help you visualize these pieces. It is worth checking out.
If you work through that analysis document (this PDF), you can see that comparing and contrasting how different reporting entities represent the same information and you can learn lots of useful things. Here are some things that seem straight forward to me:
- While there are 6 entities which use the prescribed concept, 24 entities combine the operating and capital lease disclosure and create an extension concept, 4 other combined operating and capital lease disclosures and us an OPERATING LEASE related text block, and a handful of others combined the capital lease disclosure with something else. What does that mean? Should all these permutations and combinations be added to the US GAAP XBRL Taxonomy? Or, alternatively, should the text block always be provided separately? Or, is there some other solution to this situation?
- The concepts us-gaap:CapitalLeaseObligations (which 12 filers use) and us-gaap:CapitalLeasesFutureMinimumPaymentsPresentValueOfNetMinimumPayments(which 19 filers use) appear to be representing exactly the same thing. Seems to me that one of these concepts should be removed from the US GAAP XBRL Taxonomy.
- It seems to me that US GAAP requires the disclosure of the current and noncurrent portions of the total capital lease obligation. Most filers provide this, 18 of the 35. A handful are not required to report the breakdown because they provide an unclassified balance sheet. You can sometimes sort this out by subtracting the long term debt portion from the long term debt and capital lease obligation portion to arrive at the capital lease obligation portion. But sometimes you cannot.
- The US GAAP XBRL Taxonomy provides concepts for the executory costs and interest portions which are used to arrive at total future net minimum payments. One filer includes the line item "unamortized fair value adjustment" in computation of net minimum payments. If that is correct, then there is a concept missing from the US GAAP XBRL Taxonomy. If it is not correct, then that is a reporting error. Two filers combined executory costs and interest. Is that correct? If so, that combined concept is missing from the US GAAP XBRL Taxonomy.
There is a lot more that can be gleaned from the analysis. There are also a lot of other documents which analyze disclosures here, see the section "Disclosures". Of particular interest are property, plant, and equipment components by type; property, plant, and equipment estimated useful lives; and long term debt maturities.
Those will set you on the right course for becoming a master of XBRL-based digital financial report disclosures. While I walked you through one disclosure, these same ideas apply to other disclosures also.
Charlie
in Becoming an XBRL Master Craftsman, Creating Investor Friendly SEC XBRL Filings
|
Post a Comment
| Email
| Print
Interest Based Revenues Fundamental Accounting Concepts
I have said before that there is more than one set of fundamental accounting concepts. For example, a commercial and industrial company has some different fundamental accounting concepts and relations between those concepts than a bank which uses insurance based revenues reporting or an insurance company which uses insurance based revenues reporting.
Even within the category of commercial and industrial you have differences. For example, reporting entities can use a single-step approach or a multi-step approach.
In the past I only created one set of fundamental accounting concepts because that is all I could handle due to my limitations as a programmer. That is no longer the case. Now I have commercially available tools and way, way more flexibility.
Here is an improved version of the fundamental accounting concepts for a commercial and industrial company which uses a multi-step presentation approach: (note that the single-step and multi-step are no longer mixed together)
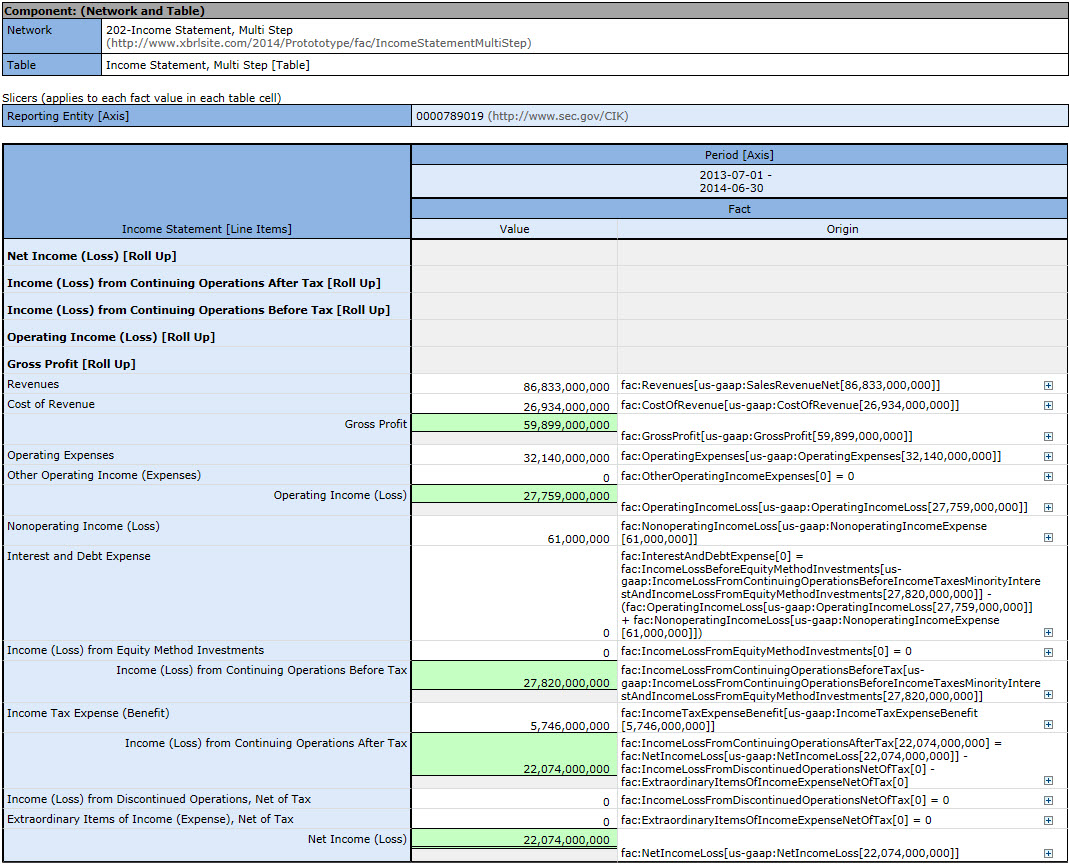 (Click image for larger view)
And here is an income statement for an interest based revenues set of fundamental accounting concepts which is commonly used by banks:
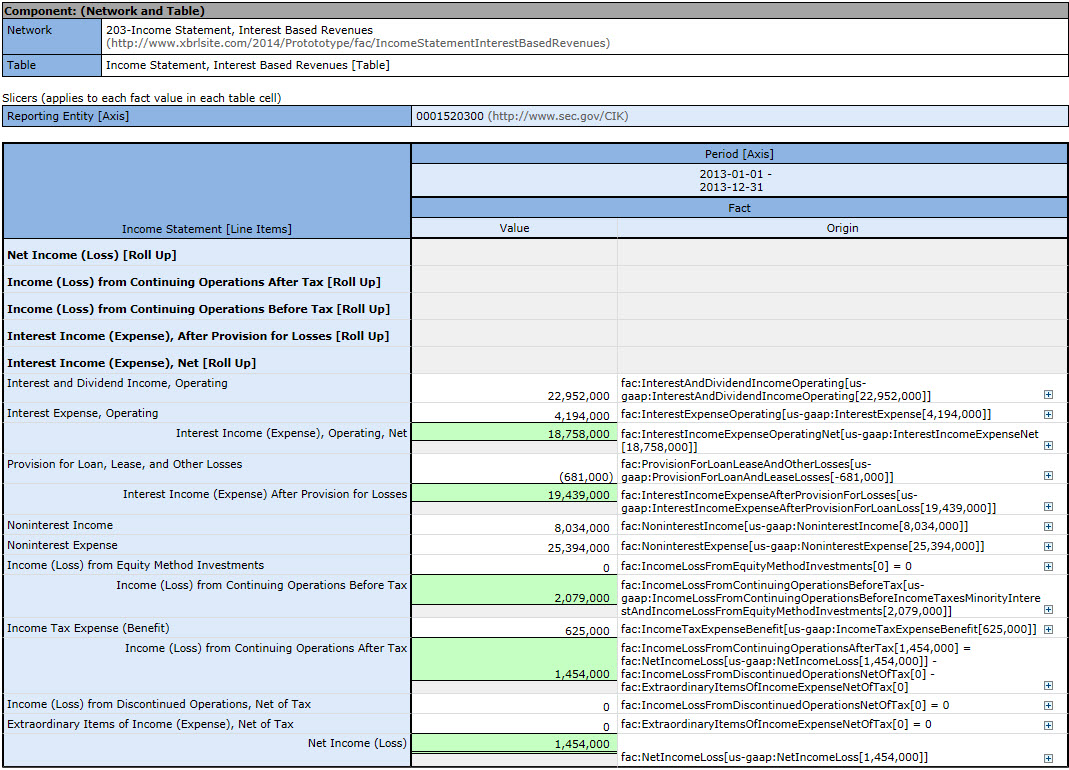 (Click for larger image)
What is the most interesting thing about this is the way I create these "report frames" as I call them. How do I do that? Simple, I just create an XBRL taxonomy. Or actually, I generate a set of XBRL taxonomies from one XBRL taxonomy that I maintain.
These are about 120 different report frames I have identified. About 75% of all reporting entities use one of about 13 report frames.
Why is this important? Because it allows a better tuning of the fundamental accounting concepts and relations between those concepts used by reporting entities.
Charlie
in Becoming an XBRL Master Craftsman
|
Post a Comment
| Email
| Print
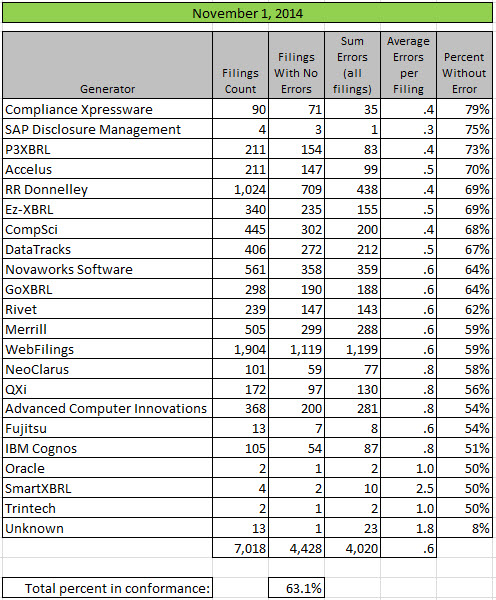
Public Company Conformance to Fundamental Relations Grows to 63.1 Percent
Because it is so easy now and because a fair amount of filings are submitted at the end of October, I re-ran my analysis of fundamental accounting concept conformance. The percentage of public companies who conform to all of these relations is up to 63.1%. This graphic shows breakdown by software vendor/filing agent:
 (Click image for larger view)
Ask yourself a question: Why exactly would conformance to accounting relations differ by software vendor or filing agent? Think about that.
Not a big percentage change, but not bad either for just about two weeks. The graphic below shows a comparison of analysis results for: March, September, October, and November. (Click the image to get a larger readable view)
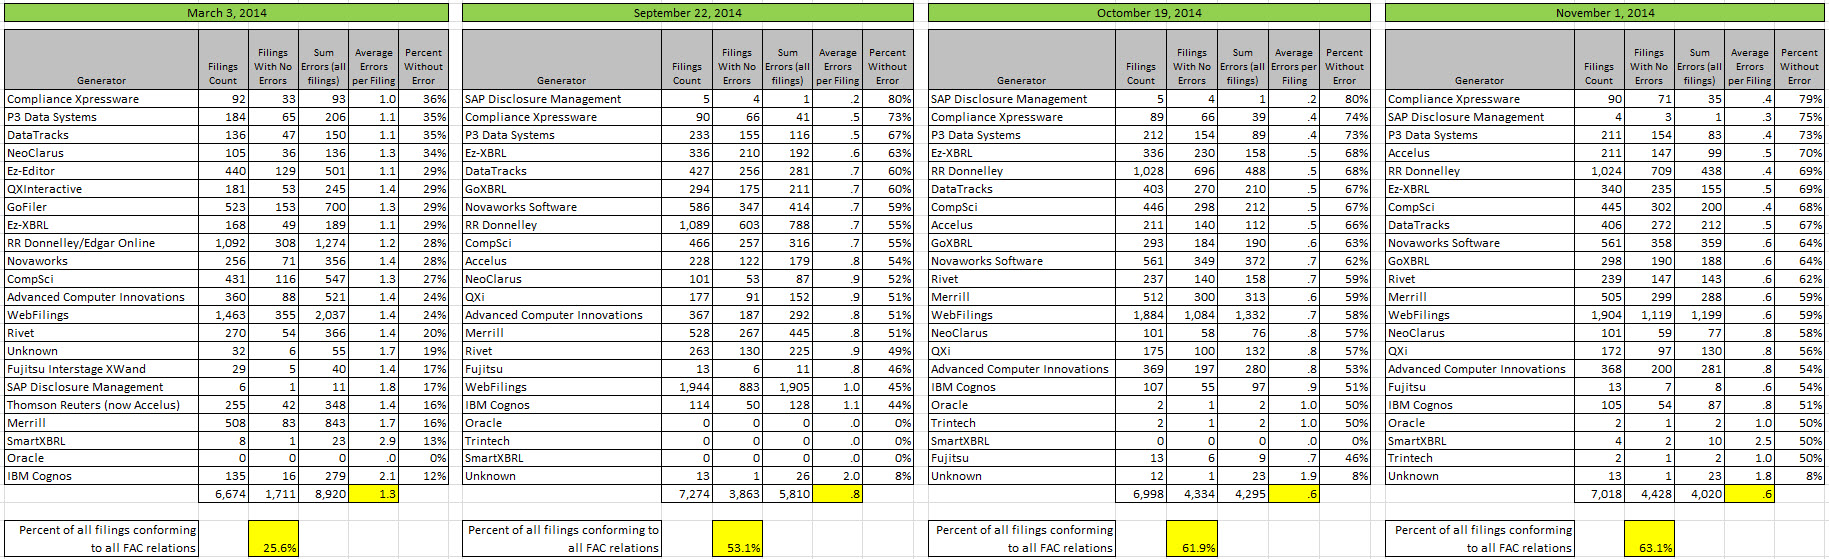 (Click image for larger view)
My testing tools continue to improve. One of the leaps that I will start making is from using one set of fundamental accounting concept relations that all filers fit into, to multiple hierarchies of relations. I have always known that there is not one set of fundamental accounting concepts, there are many sets. The data shows that about 90% of public companies all into about 10 to maybe 15 groups. I may, or may not, be able to then reconcile all of these groups together into a "super" set of fundamental accounting concepts which allows comparison across groups.
The exact number of groups will become clearer and clear as the public companies are put into groups. These are the primary groups that I have thus far. You can look at this as "industry sectors" or "accounting activities" or "industry audit guides". The point is, there are groups:
- commercial and industrial companies (most public companies, about 85% of all companies)
- interest based revenues (about 610 public companies identified so far such as banks)
- insurance based revenues (about 50 public companies identified so far, insurance companies)
- securities based revenues (about 100 public companies identified so far such as brokers/dealers in securities
- real estate investment trusts (about 130 public companies identified so far, all REITs)
- funds and trusts (about 375 public companies, no interest in these)
Each of these different types of reporting entities, or industry types or types of accounting activities, report in specific ways. From what I am seeing thus far, the most consistent and correct right not is interest based reporting. About 70% of all banks follow one consistent pattern and have complete conformance to that specific/specialized set of fundamental accounting concepts.
I am going to publish these specific/specialized sets of fundamental accounting concepts here with the rest of the information I am publishing on this topic.
One of the most interesting things that this exercise will provide is an "inventory" of the reporting flexibility which is employed by public companies. For example, see this analysis of all the places public companies report income (loss) from equity method investments.
Professional accountants, ask yourself a question. Where you aware that there were so many different places you could put that line item? Personally, I had no idea this level of flexibility existed and pretty much every accountant I have talked to was a little surprised. Was this flexibility an intended, conscious choice by those writing the accounting standards or was it caused by poor attention to detail in writing the standards? I don't know, I am simply asking the question. If you know or have an opinion, leave me a comment.
What if you could see all of this flexibility, organized by industry activity grouping? I think that is a useful tool. What do you think?
Charlie
in Becoming an XBRL Master Craftsman, Creating Investor Friendly SEC XBRL Filings
|
Post a Comment
| Email
| Print

