BLOG: Digital Financial Reporting
This is a blog for information relating to digital financial reporting. This blog is basically my "lab notebook" for experimenting and learning about XBRL-based digital financial reporting. This is my brain storming platform. This is where I think out loud (i.e. publicly) about digital financial reporting. This information is for innovators and early adopters who are ushering in a new era of accounting, reporting, auditing, and analysis in a digital environment.
Much of the information contained in this blog is synthasized, summarized, condensed, better organized and articulated in my book XBRL for Dummies and in the chapters of Intelligent XBRL-based Digital Financial Reporting. If you have any questions, feel free to contact me.
Entries in networks (2)
Introduction to Graphs for Business People
Understanding graphs is important to understanding how to use XBRL. This is particularly true if you build XBRL taxonomies with any level of sophistication.
When I say "graph", I am not talking about an "Excel graph" or "chart", those pretty pictures which display information graphically. Although, it seems to me that there is a relation between "graph" and information which is presented graphically. (But, let's not go down that path.)
A graph is defined by Wikipedia as:
Mathematical structures used to model pairwise relations between objects from a certain collection.
Key terms from above are "model" (i.e. build an XBRL taxonomy), "pairwise relations between objects" (i.e. such as accounting concepts), and "from a certain collection" (i.e. XBRL taxonmoy).
I am far from an expert in graphs. In fact, I am a novice really. But, I have been listening to technical people talk about graphs and graph related terminology for many years in creating XBRL that I have picked up a few things.
These are the key things that I have picked up:
- XBRL networks (presentation, calculation, definition) are graphs.
- What most people think of as a "tree" is a type of graph. Not all graphs are trees. But, all trees are graphs.
- This is a Wikipedia article with a good summary of graph theory.
- This tutorial is a great little tutorial which will help you understand the fundamental concepts of graphs. It helps you understand terms used in XBRL such as graph, cycle, path, and so forth.
- Here is a glossary of graph related terminology.
- Graphs are a way to represent relations. Showing those in a "tree view control" is only ONE way to represent that information. It is definitely not the ONLY way. Most software developers building XBRL applications have not figured this out yet. Some have. Help them understand this, it will help the usability of XBRL software.
- Terminology such as cycles, directed cycles and undirected cycles become more meaningful when you understand graphs.
- You cannot build good XBRL taxonomies if you don't understand cycles.
- XBRL is part of the Semantic Web. Realize that RDF expresses graphs. For right now, just keep the term RDF (Resource Definition Framework). You will want to know about that, but let's not get into that now. You will also want to know about OWL (Web Ontology Language). I will get into these later, again, just keep these in the back of your mind and realize that they are important.
Feel a little overwhelmed and confused? That is always the beginning point of learning, feeling overwhelmed and confused. Just realize that if you really want to understand XBRL to be good enough to create quality information models with XBRL, you need to understand what graphs are. Take the time to read the information above and work through the tutorial.
Not every business user needs to understand graphs, but if you want to build good XBRL taxonomies, you definitely need to understand graphs. Hopefully this information will help you towards that end. I don't have the expertise to explain this to others in detail at this point, that is why I am just pointing you to other information.
 Charlie
in Graphs, Modeling Business Information Using XBRL, XBRL General Information, networks
|
Charlie
in Graphs, Modeling Business Information Using XBRL, XBRL General Information, networks
|
 Post a Comment
|
Post a Comment
|  Email
|
Email
|  Print
Print
Organizing Networks and Hypercubes to Get a Flow
You have all those concepts in an XBRL taxonomy schema. You can organize those into useful groups of information. This is done by putting concepts into a network (i.e. presentation, calculation, definition). You can further organize these into hypercubes if you want to use the multidimensional model.
But, how do you organize the networks and/or hypercubes? This is what I mean by flow. (Go to that blog entry for more information on flow.)
Consider this fairly simple example of a financial statement. Here is how I did it:
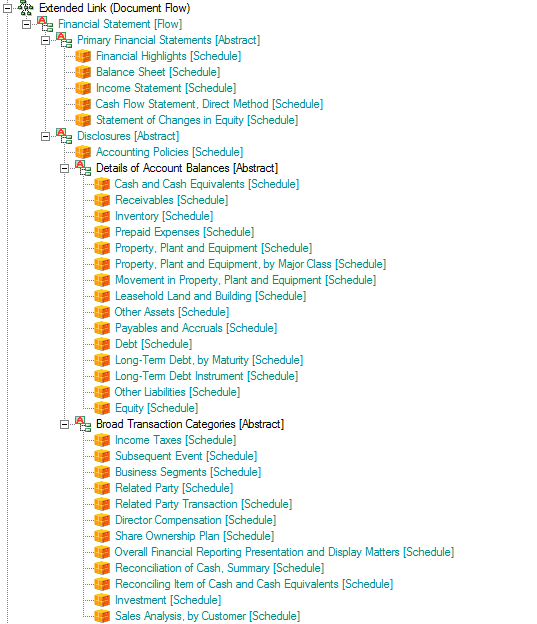
What I did was the following:
- Create a definition network. I created the network role of http://www.example.com/DocumentFlow. (You could do this using the presentation network, but if you use the definition network you can create custom arcroles, I will get to that in a moment.)
- Create an arcrole if you want, but I just used the "general-special" arcrole for now.
- Use abstract concepts and the hypercubes you have created in your taxonomy to organize the flow of the report.
Here is another version of that screen shot, an HTML page where you can see both the flow and the other parts of the XBRL taxonomy.
There are some important characteristics of networks and hypercubes which you need to understand in order to understand the issues and solve them.
- There is no way to order networks in XBRL. Or rather, there is no standard way. You can always create a proprietary way, but the problem is that if users are using different software applications they will very likely get different results. Two ways to overcome this are to (a) use the physical order in which the networks appear or (b) sort the networks by their definition. Sorting by the definitions of the networks is how the US GAAP Taxonomy was built to be used, that is why the numbers are in the network definitions.
- There is no way to provide a hierarchy of networks in XBRL. You can order the networks by using one of the two approaches above, but that approach limits you to a flat sorted list. It would be nice if you could put the networks into a hierarchy, like the taxonomy concepts themselves.
- You cannot "jump" between networks. A good way to understand this is to say that you can jump between networks in the definition linkbase if you use XBRL Dimensions. This is achieved using the targetRole attribute. What this allows is for pieces of a hypercube (the dimensions, the domains, the members, the primary items) to be defined within different networks (i.e. extended links of the same role) but then use them together. This is a very handy feature. But again, it does not exist in XBRL 2.1, only in XBRL Dimensions.
- Hypercubes are XBRL taxonomy schema XBRL elements all of which have the substitutionGroup value of "xbrldt:hypercubeItem".
- So, to organize the hypercubes into a flow, I simply create a network which includes only abstract elements which provide a means of adding hierarchy or structure and then put each hypercube into that structure in the order that I want to see it.
Now, there are some subtleties which are helpful to understand. To make this work, you should give each hypercube a unique name. If you do this, the network really becomes irrelevant from a flow perspective, as the hypercube becomes your way to identify which piece of the taxonomy you want to point to. Besides, personally, I believe that it is a good idea to give each unique hypercube a unique name which describes what that hypercube is trying to communicate. In contrast, the US GAAP Taxonomy used the same hypercube "Statement [Table]" for every primary financial statement. For example, here that one hypercube is used to define a balance sheet and here that very same hypercube is used to define an income statement. What that means is that you MUST use the network in addition to the hypercube to identify the hypercube. Whereas, if the names were unique, you would only need the hypercube name to identify the hypercube. The fact that the US GAAP Taxonomy uses the same hypercube to mean different things, the approach outlined above will not work for that XBRL taxonomy. So, when you build your XBRL taxonomy, I would suggest making each hypercube name unique.
Then, what this allows is an interfact which looks something like this. Notice the flow on the left. Each hypercube shows up in the list, they can be read from the "flow" network which you define. Click on the hypercube, and that hypercube is rendered in the right side pane.
That flow network allows for two things: First, you can define the order that you want. Second, if other users don't like your flow, the can change it by simply creating an extension to the XBRL taxonomy! Altertatively, they can simply create their own flow network in the form of an XBRL taxonomy.
For example, you could put line items, policies, and disclosures which relate to each other together as you see desire. Interactive information!
Charlie
in Flow, Modeling Business Information Using XBRL, XBRL General Information, hypercubes, networks
|
Post a Comment
| Email
| Print
